. 2012 Mar 20:3:750.
doi: 10.1038/ncomms1743.

Degradation of MONOCULM 1 by APC/C(TAD1) regulates rice tillering

Affiliations
Free PMC article

Degradation of MONOCULM 1 by APC/C(TAD1) regulates rice tillering

Cao Xu et al. Nat Commun. .
Free PMC article

Abstract

A rice tiller is a specialized grain-bearing branch that contributes greatly to grain yield. The MONOCULM 1 (MOC1) gene is the first identified key regulator controlling rice tiller number; however, the underlying mechanism remains to be elucidated. Here we report a novel rice gene, Tillering and Dwarf 1 (TAD1), which encodes a co-activator of the anaphase-promoting complex (APC/C), a multi-subunit E3 ligase. Although the elucidation of co-activators and individual subunits of plant APC/C involved in regulating plant development have emerged recently, the understanding of whether and how this large cell-cycle machinery controls plant development is still very limited. Our study demonstrates that TAD1 interacts with MOC1, forms a complex with OsAPC10 and functions as a co-activator of APC/C to target MOC1 for degradation in a cell-cycle-dependent manner. Our findings uncovered a new mechanism underlying shoot branching and shed light on the understanding of how the cell-cycle machinery regulates plant architecture.


Figures

Figure 1
Figure 1. Map-based cloning and characterization of TAD1.
(a) The phenotypes of the wild type (left) and tad1 (right). Scale bar, 10 cm. (b) Comparison of tiller number between the wild type (left) and tad1 (right). Values are means with s.e. (n=35 plants). The double asterisks represent the significant difference determined by the t-test at P<0.01. (c) Comparison of plant height between the wild type (left) and tad1 (right). Scale bar, 10 cm. (d) The panicle and flag leaf of the wild type. Scale bar, 3 cm. (e) The panicle and flag leaf of tad1. Scale bar, 3 cm. (f) Map-based cloning of TAD1. TAD1 was mapped in a 22.5-kb DNA region between the molecular markers, RM523 and S1273, on chromosome 3. Blue arrows represent the four predicted open reading frames, the red arrow indicates a single base substitution in the second exon of LOC_Os03g03150 in tad1 and the red letter represents the mutation of G to A that results in a stop codon TGA. (g) Growth of S. pombe transformed with pREP5N-TAD1, pREP5N-SRW1 and the empty vector pREP5N in the presence and absence of thiamine. (h) Phenotypes of S. pombe cells transformed with pREP2-TAD1 and the empty vector pREP2 in the absence of thiamine. Scale bars, 10 μm.
Figure 2
Figure 2. Expression patterns of TAD1.
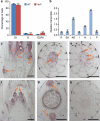
(a) Flow cytometric analysis of the cell-cycle profiles of the wild type (WT) and mutant (tad1). Nuclei released from the wild-type and tad1 suspension cells were stained with 4,6-diamidino-2-phenylindole (DAPI) for flow cytometry analysis. The percentage of cells in each phase of the cell cycle was quantified by the ModFit LT software. Values are means with s.e. (n=4). The double asterisks indicate the significant difference determined by the two-tailed t-test at P<0.01. (b)TAD1 transcript levels in various organs, including roots (R), shoot apexes of seedlings (SA), axillary buds (AB), internodes (I), nodes (N), young leaves (L) and young panicles (P). Values are means with s.d. of three independent experiments. (c–h) TAD1 expression patterns revealed by messenger RNA in situ hybridization. YL, young leaf; TB, tiller bud; IF, inflorescence; SA, shoot apex; CR, crown root; V, vascular bundle. Arrows in (cg) indicate the TAD1 expression sites. (h) The in situ hybridization result with TAD1 sense probe. Scale bars, 500 μm.
Figure 3
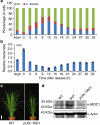
Figure 3. Expression of TAD1 during the cell-cycle progression and phenotypes of TAD1-overexpressing transgenic plants.
(a) Flow cytometry analysis of asynchronously growing (Asyn) and synchronized rice suspension cells after release from aphidicolin at indicated time points. The number of cells in the G1-, S- or G2/M-phase is given as percentages of the total cell population. (b) TAD1 expression levels during the cell-cycle progression. (c) Phenotypes of TAD1-overexpressing transgenic plants. Scale bar, 10 cm. (d) Immunodetection of endogenous MOC1 levels in the wild-type, tad1 and TAD1-overexpressing transgenic plants.
Figure 4
Figure 4. Determination of the interaction between TAD1 and MOC1 by coimmunoprecipitation and BiFC assays.
(a) The conserved D-box motif at the MOC1 N-terminal and its mutated construct (mMOC1). (b) In vivo interaction between TAD1 and MOC1 revealed by the coimmunoprecipitation assay. (c) BiFC analysis of interaction between MOC1 and TAD1 in rice protoplasts. Scale bars, 10 μm. (d) Schematic representation of the truncated TAD1 proteins. Blue box refers to C-box, green to CSM, pink to WD repeats, white to RVL, and red to IR. (e) BiFC analyses of in vivo interaction between MOC1 and truncated TAD1 proteins indicated in (d). Scale bars, 10 μm.
Figure 5
Figure 5. TAD1 targets MOC1 in a cell-cycle phase-dependent manner.
(a) Cell-free degradation assay showing the proteasome-dependent degradation of MOC1. Detection of Actin served as an internal control. (b) In vitro ubiquitination assay of immunopurified MOC1-GFP in the presence of recombinant HA–ubiquitin. The arrow represents unmodified MOC1-GFP, and the brace refers to ubiquitination-modified MOC1-GFP. (c) In vitro cell-free degradation assay showing the delayed degradation of expressed recombinant GST-MOC1 in tad1 and GST-mMOC1 in the wild type. The protein levels at different time points were detected by western blotting using the GST antibodies. (d) Dynamic degradation of MOC1-GFP in the wild-type (WT) and tad1 transgenic calli. Immunoblotting by the GFP antibodies showed the remaining protein levels of MOC1-GFP at different time points. (e) Profiles of TAD1 and MOC1 protein levels during the cell-cycle progression. The cell-cycle phase is determined by flow cytometry at different time points after release from synchronized rice suspension cells as indicated in the scheme at bottom. Black triangles refer to the TAD1 or MOC1 protein in the immunoblots, respectively.
Figure 6
Figure 6. The APC/CTAD1 complex-mediated degradation of MOC1.
(a) BiFC assays indicated the interaction between TAD1 and OsAPC10 in the nucleus of rice protoplasts. The N-terminal 460 amino acids of TAD1 served as a negative control for the BiFC assay. Scale bars, 10 μm. (b) MOC1 coimmunoprecipitated with TAD1 and OsAPC10 in vivo. IP, immunoprecipitation. (c) A working model of rice tillering regulated by the APC/CTAD1 complex.

Similar articles

Cited by

References

    1. Wang Y. & Li J. Branching in rice. Curr. Opin. Plant Biol. 14, 94–99 (2011). - PubMed
    1. Li X. et al.. Control of tillering in rice. Nature 422, 618–621 (2003). - PubMed
    1. Schumacher K., Schmitt T., Rossberg M., Schmitz G. & Theres K. The Lateral suppressor (Ls) gene of tomato encodes a new member of the VHIID protein family. Proc. Natl Acad. Sci. USA 96, 290–295 (1999). - PMC - PubMed
    1. Greb T. et al.. Molecular analysis of the LATERAL SUPPRESSOR gene in Arabidopsis reveals a conserved control mechanism for axillary meristem formation. Genes Dev. 17, 1175–1187 (2003). - PMC - PubMed
    1. Oikawa T. & Kyozuka J. Two-step regulation of LAX PANICLE1 protein accumulation in axillary meristem formation in rice. Plant Cell 21, 1095–1108 (2009). - PMC - PubMed

Publication types

MeSH terms