

3-D illustration of network orientations of interstitial cells of Cajal subgroups in human colon as revealed by deep-tissue imaging with optical clearing
- PMID: 22421617
- PMCID: PMC3362097
- DOI: 10.1152/ajpgi.00432.2011
3-D illustration of network orientations of interstitial cells of Cajal subgroups in human colon as revealed by deep-tissue imaging with optical clearing
Abstract
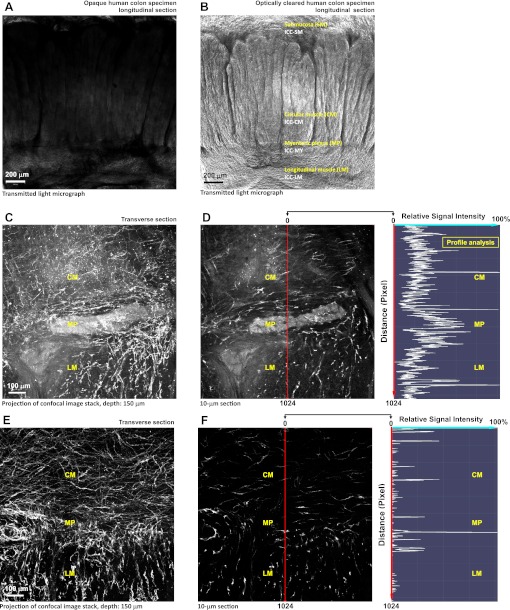
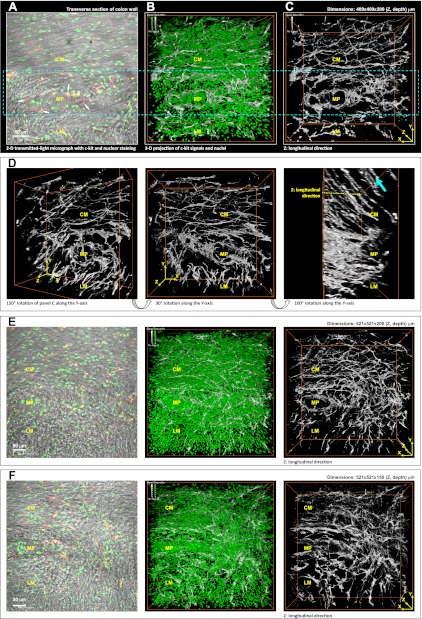
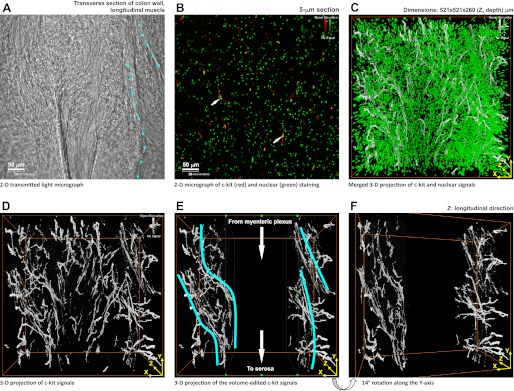
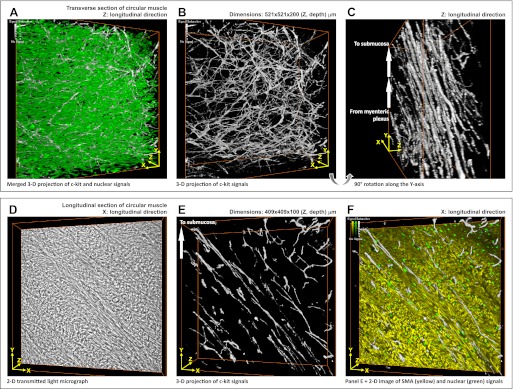
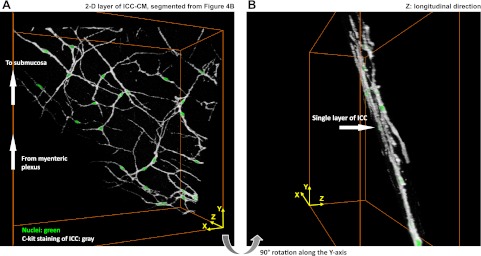
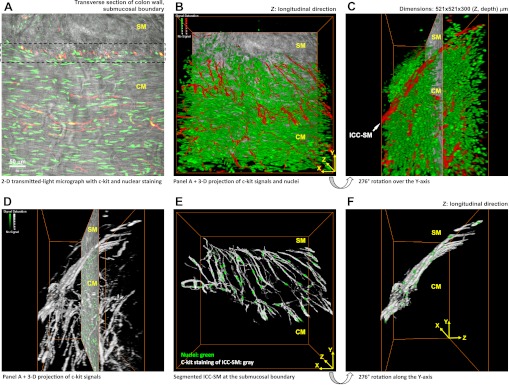
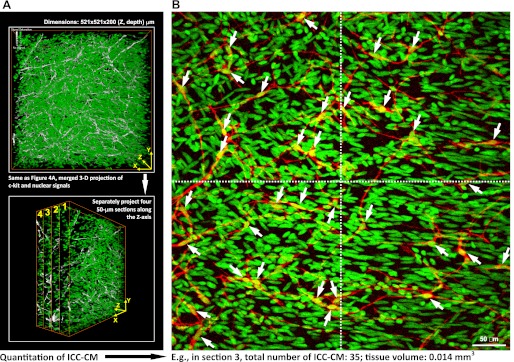
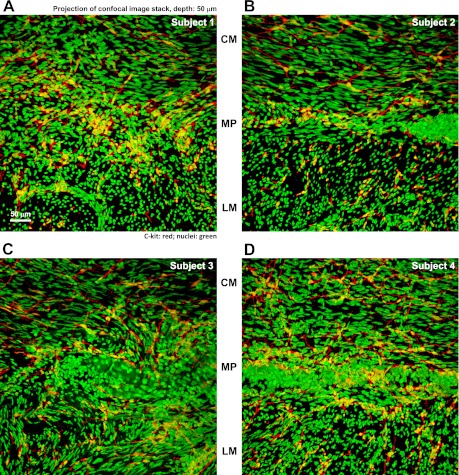
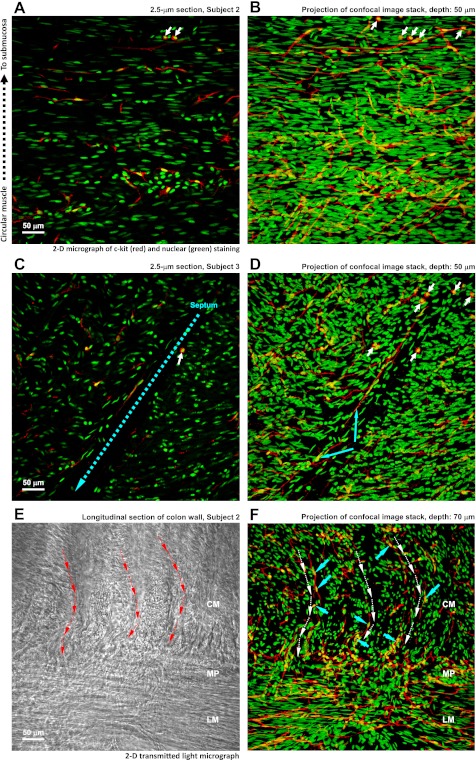
Morphological changes of interstitial cells of Cajal (ICC) have been proposed to characterize motility disorders. However, a global view of the network orientations of ICC subgroups has not been established to illustrate their three-dimensional (3-D) architectures in the human colon. In this research, we integrate c-kit immunostaining, 3-D microscopy with optical clearing, and image rendering to present the location-dependent network orientations with high definition. Full-depth colonic tissues were obtained from colectomies performed for nonobstructing carcinoma. Specimens of colon wall were prepared away from the tumor site. C-kit and nuclear fluorescent staining were used to identify the ICC processes and cell body. Optical clearing was used to generate transparent colon specimens, which led to panoramic visualization of the fluorescence-labeled ICC networks at the myenteric plexus (ICC-MY), longitudinal (ICC-LM) and circular (ICC-CM) muscles, and submucosal boundary (ICC-SM) up to 300 μm in depth via confocal microscopy with subcellular level resolution. We observed four distinct network patterns: 1) periganglionic ICC-MY that connect with ICC-LM and ICC-CM, 2) plexuses of ICC-LM within the longitudinal muscle and extending toward the serosa, 3) repetitive and organized ICC-CM layers running parallel to the circular muscle axis and extending toward the submucosa, and 4) a condensed ICC-SM layer lining the submucosal border. Among the four patterns, the orderly aligned ICC-CM layers provide an appropriate target for quantitation. Our results demonstrate the location-dependent network orientations of ICC subgroups and suggest a practical approach for in-depth imaging and quantitative analysis of ICC in the human colon specimen.
Figures
Similar articles
-
Perivascular Interstitial Cells of Cajal in Human Colon.Cell Mol Gastroenterol Hepatol. 2014 Dec 4;1(1):102-119. doi: 10.1016/j.jcmgh.2014.11.003. eCollection 2015 Jan. Cell Mol Gastroenterol Hepatol. 2014. PMID: 28247865 Free PMC article.
-
Postnatal development of interstitial cells of Cajal in mouse colon in response to Kit signal blockade with Imatinib (Glivec).Acta Histochem. 2010 May;112(3):215-21. doi: 10.1016/j.acthis.2010.02.003. Epub 2010 Mar 2. Acta Histochem. 2010. PMID: 20199801
-
Distribution, development and proliferation of interstitial cells of Cajal in murine colon: an immunohistochemical study from neonatal to adult life.Histochem Cell Biol. 2010 Feb;133(2):163-75. doi: 10.1007/s00418-009-0655-4. Epub 2009 Nov 6. Histochem Cell Biol. 2010. PMID: 19894060
-
Identification of interstitial cells of Cajal. Significance for studies of human small intestine and colon.Dan Med Bull. 1994 Jun;41(3):275-93. Dan Med Bull. 1994. PMID: 7924459 Review.
-
Gap junctions in intestinal smooth muscle and interstitial cells of Cajal.Microsc Res Tech. 1999 Dec 1;47(5):309-20. doi: 10.1002/(SICI)1097-0029(19991201)47:5<309::AID-JEMT2>3.0.CO;2-K. Microsc Res Tech. 1999. PMID: 10602290 Review.
Cited by
-
Interstitial cells in the primate gastrointestinal tract.Cell Tissue Res. 2012 Nov;350(2):199-213. doi: 10.1007/s00441-012-1468-7. Epub 2012 Aug 3. Cell Tissue Res. 2012. PMID: 22864981 Free PMC article.
-
3-D imaging and illustration of the perfusive mouse islet sympathetic innervation and its remodelling in injury.Diabetologia. 2012 Dec;55(12):3252-61. doi: 10.1007/s00125-012-2699-6. Epub 2012 Aug 30. Diabetologia. 2012. PMID: 22930160
-
Frequent Intraluminal Growth of Large Muscular Veins in Surgically Resected Colorectal Cancer Tissues: A 3-Dimensional Pathologic Reconstruction Study.Mod Pathol. 2023 Mar;36(3):100082. doi: 10.1016/j.modpat.2022.100082. Epub 2023 Jan 10. Mod Pathol. 2023. PMID: 36788099 Free PMC article.
-
Plasticity of Schwann cells and pericytes in response to islet injury in mice.Diabetologia. 2013 Nov;56(11):2424-34. doi: 10.1007/s00125-013-2977-y. Epub 2013 Jun 26. Diabetologia. 2013. PMID: 23801221
-
Numerical metrics for automated quantification of interstitial cell of Cajal network structural properties.J R Soc Interface. 2013 Jun 26;10(86):20130421. doi: 10.1098/rsif.2013.0421. Print 2013 Sep 6. J R Soc Interface. 2013. PMID: 23804441 Free PMC article.
References
-
- Burns AJ, Herbert TM, Ward SM, Sanders KM. Interstitial cells of Cajal in the guinea-pig gastrointestinal tract as revealed by c-Kit immunohistochemistry. Cell Tissue Res 290: 11–20, 1997 - PubMed
-
- Carl Zeiss Microimaging GmbH Visualizing the architecture of cells and tissues. [Available at: http://www.zeiss.de/C1256D18002CC306/Order?OpenForm&lsm-bio], 2012
-
- Farrugia G. Interstitial cells of Cajal in health and disease. Neurogastroenterol Motil 20, Suppl 1: 54–63, 2008 - PubMed
-
- Faussone-Pellegrini MS, Thuneberg L. Guide to the identification of interstitial cells of Cajal. Microsc Res Tech 47: 248–266, 1999 - PubMed
Publication types
MeSH terms
Grants and funding
LinkOut - more resources
Full Text Sources
Other Literature Sources