

Plasma membrane potential oscillations in insulin secreting Ins-1 832/13 cells do not require glycolysis and are not initiated by fluctuations in mitochondrial bioenergetics
- PMID: 22418435
- PMCID: PMC3346073
- DOI: 10.1074/jbc.M111.314567
Plasma membrane potential oscillations in insulin secreting Ins-1 832/13 cells do not require glycolysis and are not initiated by fluctuations in mitochondrial bioenergetics
Abstract
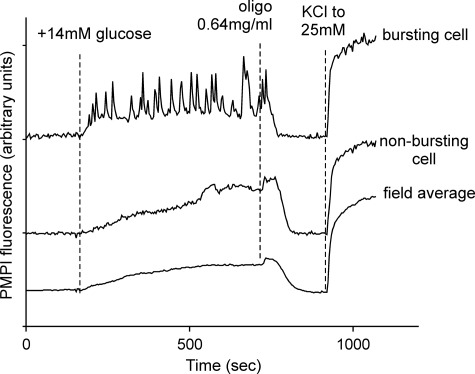
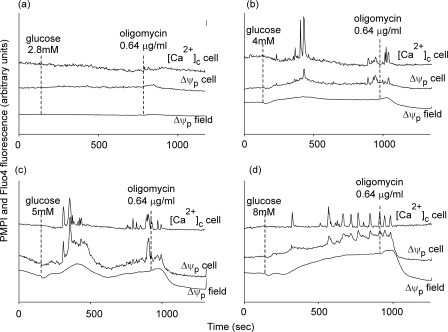
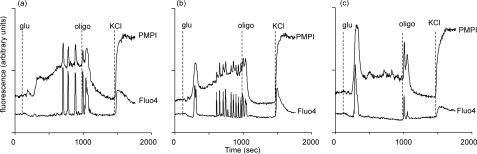
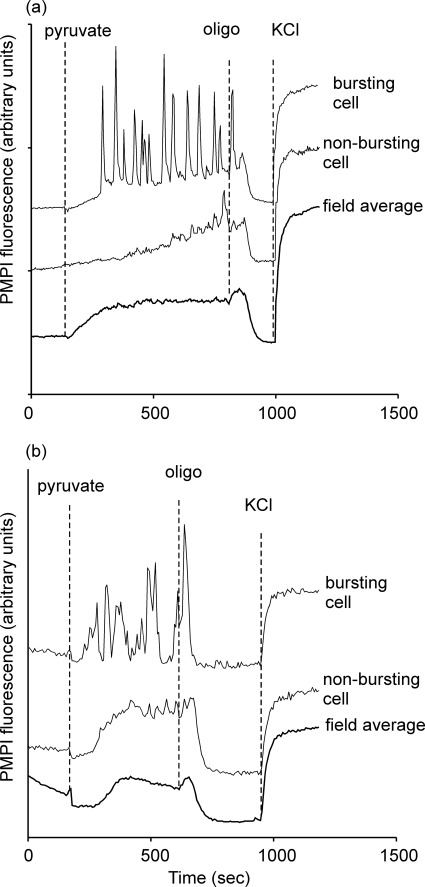
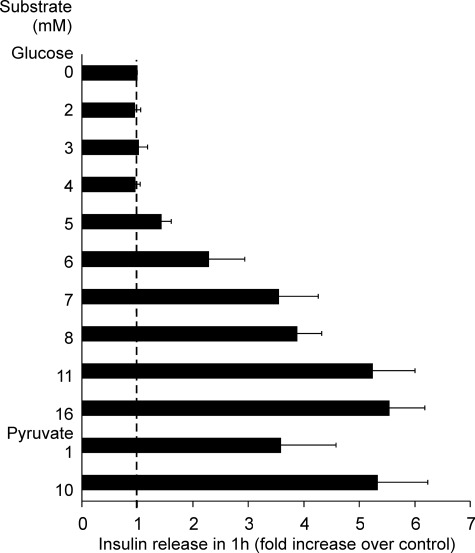
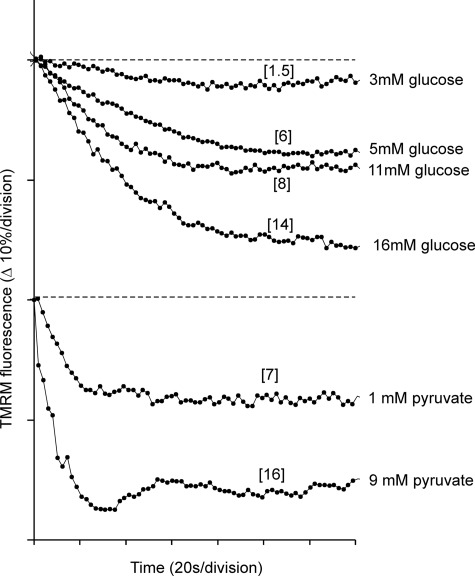
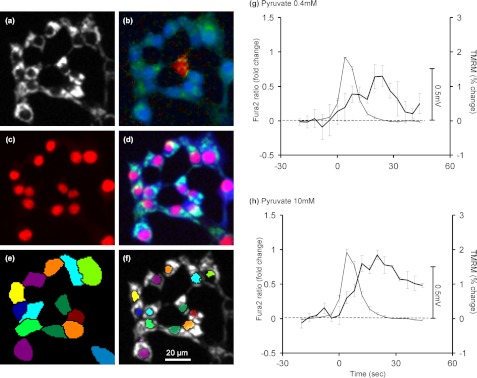
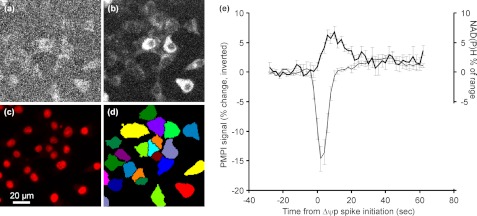
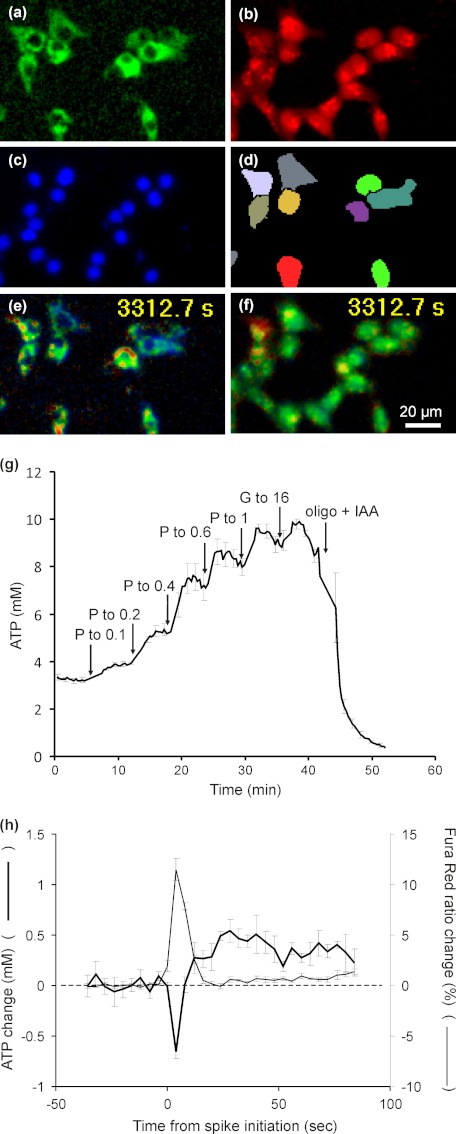
Oscillations in plasma membrane potential play a central role in glucose-induced insulin secretion from pancreatic β-cells and related insulinoma cell lines. We have employed a novel fluorescent plasma membrane potential (Δψ(p)) indicator in combination with indicators of cytoplasmic free Ca(2+) ([Ca(2+)](c)), mitochondrial membrane potential (Δψ(m)), matrix ATP concentration, and NAD(P)H fluorescence to investigate the role of mitochondria in the generation of plasma membrane potential oscillations in clonal INS-1 832/13 β-cells. Elevated glucose caused oscillations in plasma membrane potential and cytoplasmic free Ca(2+) concentration over the same concentration range required for insulin release, although considerable cell-to-cell heterogeneity was observed. Exogenous pyruvate was as effective as glucose in inducing oscillations, both in the presence and absence of 2.8 mM glucose. Increased glucose and pyruvate each produced a concentration-dependent mitochondrial hyperpolarization. The causal relationships between pairs of parameters (Δψ(p) and [Ca(2+)](c), Δψ(p) and NAD(P)H, matrix ATP and [Ca(2+)](c), and Δψ(m) and [Ca(2+)](c)) were investigated at single cell level. It is concluded that, in these β-cells, depolarizing oscillations in Δψ(p) are not initiated by mitochondrial bioenergetic changes. Instead, regardless of substrate, it appears that the mitochondria may simply be required to exceed a critical bioenergetic threshold to allow release of insulin. Once this threshold is exceeded, an autonomous Δψ(p) oscillatory mechanism is initiated.
Figures
Similar articles
-
Glucose-dependent increase in mitochondrial membrane potential, but not cytoplasmic calcium, correlates with insulin secretion in single islet cells.Am J Physiol Endocrinol Metab. 2006 Jan;290(1):E143-E148. doi: 10.1152/ajpendo.00216.2005. Epub 2005 Sep 6. Am J Physiol Endocrinol Metab. 2006. PMID: 16144817
-
Ca2+ controls slow NAD(P)H oscillations in glucose-stimulated mouse pancreatic islets.J Physiol. 2006 Apr 15;572(Pt 2):379-92. doi: 10.1113/jphysiol.2005.101766. Epub 2006 Feb 2. J Physiol. 2006. PMID: 16455690 Free PMC article.
-
Essential role of mitochondrial Ca2+ uniporter in the generation of mitochondrial pH gradient and metabolism-secretion coupling in insulin-releasing cells.J Biol Chem. 2015 Feb 13;290(7):4086-96. doi: 10.1074/jbc.M114.632547. Epub 2014 Dec 29. J Biol Chem. 2015. PMID: 25548283 Free PMC article.
-
What couples glycolysis to mitochondrial signal generation in glucose-stimulated insulin secretion?IUBMB Life. 2000 May;49(5):391-5. doi: 10.1080/152165400410236. IUBMB Life. 2000. PMID: 10902570 Review.
-
Perspective: emerging evidence for signaling roles of mitochondrial anaplerotic products in insulin secretion.Am J Physiol Endocrinol Metab. 2005 Jan;288(1):E1-15. doi: 10.1152/ajpendo.00218.2004. Am J Physiol Endocrinol Metab. 2005. PMID: 15585595 Review.
Cited by
-
Positive Feedback Amplifies the Response of Mitochondrial Membrane Potential to Glucose Concentration in Clonal Pancreatic Beta Cells.Biochim Biophys Acta Mol Basis Dis. 2017 May;1863(5):1054-1065. doi: 10.1016/j.bbadis.2016.10.015. Epub 2016 Oct 20. Biochim Biophys Acta Mol Basis Dis. 2017. PMID: 27771512 Free PMC article.
-
Characterization of stimulus-secretion coupling in the human pancreatic EndoC-βH1 beta cell line.PLoS One. 2015 Mar 24;10(3):e0120879. doi: 10.1371/journal.pone.0120879. eCollection 2015. PLoS One. 2015. PMID: 25803449 Free PMC article.
-
Oscillations of sub-membrane ATP in glucose-stimulated beta cells depend on negative feedback from Ca(2+).Diabetologia. 2013 Jul;56(7):1577-86. doi: 10.1007/s00125-013-2894-0. Epub 2013 Mar 28. Diabetologia. 2013. PMID: 23536115 Free PMC article.
-
Mitochondrial Ca2+ uptake 1 (MICU1) and mitochondrial ca2+ uniporter (MCU) contribute to metabolism-secretion coupling in clonal pancreatic β-cells.J Biol Chem. 2012 Oct 5;287(41):34445-54. doi: 10.1074/jbc.M112.392084. Epub 2012 Aug 17. J Biol Chem. 2012. PMID: 22904319 Free PMC article.
-
Single-cell imaging tools for brain energy metabolism: a review.Neurophotonics. 2014 Jul;1(1):011004. doi: 10.1117/1.NPh.1.1.011004. Epub 2014 May 29. Neurophotonics. 2014. PMID: 26157964 Free PMC article.
References
-
- Ashcroft F. M., Proks P., Smith P. A., Ammälä C., Bokvist K., Rorsman P. (1994) Stimulus-secretion coupling in pancreatic β cells. J. Cell Biochem. 55, 54–65 - PubMed
-
- Dahlgren G. M., Kauri L. M., Kennedy R. T. (2005) Substrate effects on oscillations in metabolism, calcium and secretion in single mouse islets of Langerhans. Biochim. Biophys. Acta 1724, 23–36 - PubMed
-
- Song S. H., McIntyre S. S., Shah H., Veldhuis J. D., Hayes P. C., Butler P. C. (2000) Direct measurement of pulsatile insulin secretion from the portal vein in human subjects. J. Clin. Endocrinol. Metab. 85, 4491–4499 - PubMed
-
- Pørksen N., Hollingdal M., Juhl C., Butler P., Veldhuis J. D., Schmitz O. (2002) Pulsatile insulin secretion. Detection, regulation, and role in diabetes. Diabetes 51, S245–S254 - PubMed
-
- Gilon P., Henquin J. C. (1992) Influence of membrane potential changes on cytoplasmic Ca2+ concentration in an electrically excitable cell, the insulin-secreting pancreatic B-cell. J. Biol. Chem. 267, 20713–20720 - PubMed
Publication types
MeSH terms
Substances
Grants and funding
LinkOut - more resources
Full Text Sources
Medical
Miscellaneous
