Monitoring the induction of heat shock factor 1/heat shock protein 70 expression following 17-allylamino-demethoxygeldanamycin treatment by positron emission tomography and optical reporter gene imaging
- PMID: 22418029
- PMCID: PMC5400108
Monitoring the induction of heat shock factor 1/heat shock protein 70 expression following 17-allylamino-demethoxygeldanamycin treatment by positron emission tomography and optical reporter gene imaging
Abstract
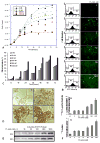
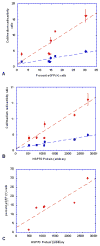
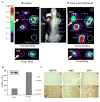
The cell response to proteotoxic cell stresses is mediated primarily through activation of heat shock factor 1 (HSF1). This transcription factor plays a major role in the regulation of the heat shock proteins (HSPs), including HSP70. We demonstrate that an [124I]iodide-pQHNIG70 positron emission tomography (PET) reporter system that includes an inducible HSP70 promoter can be used to image and monitor the activation of the HSF1/HSP70 transcription factor in response to drug treatment (17-allylamino-demethoxygeldanamycin [17-AAG]). We developed a dual imaging reporter (pQHNIG70) for noninvasive imaging of the heat shock response in cell culture and living animals previously and now study HSF1/HSP70 reporter activation in both cell culture and tumor-bearing animals following exposure to 17-AAG. 17-AAG (10-1,000 nM) induced reporter expression; a 23-fold increase was observed by 60 hours. Good correspondence between reporter expression and HSP70 protein levels were observed. MicroPET imaging based on [124I]iodide accumulation in pQHNIG70-transduced RG2 xenografts showed a significant 6.2-fold reporter response to 17-AAG, with a corresponding increase in tumor HSP70 and in tumor human sodium iodide symporter and green fluorescent protein reporter proteins. The HSF1 reporter system can be used to screen anticancer drugs for induction of cytotoxic stress and HSF1 activation both in vitro and in vivo.
Figures


Similar articles
-
HSP70-inducible hNIS-IRES-eGFP reporter imaging: response to heat shock.Mol Imaging. 2007 Nov-Dec;6(6):404-16. Mol Imaging. 2007. PMID: 18053411
-
Molecular stress-inducing compounds increase osteoclast formation in a heat shock factor 1 protein-dependent manner.J Biol Chem. 2014 May 9;289(19):13602-14. doi: 10.1074/jbc.M113.530626. Epub 2014 Apr 1. J Biol Chem. 2014. PMID: 24692538 Free PMC article.
-
Resveratrol induces apoptosis in K562 (chronic myelogenous leukemia) cells by targeting a key survival protein, heat shock protein 70.Cancer Sci. 2008 Jun;99(6):1109-16. doi: 10.1111/j.1349-7006.2008.00809.x. Epub 2008 Apr 21. Cancer Sci. 2008. PMID: 18429957 Free PMC article.
-
Role of a Heat Shock Transcription Factor and the Major Heat Shock Protein Hsp70 in Memory Formation and Neuroprotection.Cells. 2021 Jun 29;10(7):1638. doi: 10.3390/cells10071638. Cells. 2021. PMID: 34210082 Free PMC article. Review.
-
PET reporter systems for the brain.Trends Neurosci. 2023 Nov;46(11):941-952. doi: 10.1016/j.tins.2023.08.007. Epub 2023 Sep 19. Trends Neurosci. 2023. PMID: 37734962 Free PMC article. Review.
Cited by
-
In vivo imaging of induction of heat-shock protein-70 gene expression with fluorescence reflectance imaging and intravital confocal microscopy following brain ischaemia in reporter mice.Eur J Nucl Med Mol Imaging. 2013 Feb;40(3):426-38. doi: 10.1007/s00259-012-2277-7. Epub 2012 Nov 8. Eur J Nucl Med Mol Imaging. 2013. PMID: 23135322
-
Noninvasive molecular imaging of neuroinflammation.J Cereb Blood Flow Metab. 2012 Jul;32(7):1393-415. doi: 10.1038/jcbfm.2012.53. Epub 2012 May 2. J Cereb Blood Flow Metab. 2012. PMID: 22549622 Free PMC article. Review.
-
Peptide deformylase inhibitor actinonin reduces celastrol's HSP70 induction while synergizing proliferation inhibition in tumor cells.BMC Cancer. 2014 Mar 4;14:146. doi: 10.1186/1471-2407-14-146. BMC Cancer. 2014. PMID: 24589236 Free PMC article.
-
Discovery of a Chemical Probe Bisamide (CCT251236): An Orally Bioavailable Efficacious Pirin Ligand from a Heat Shock Transcription Factor 1 (HSF1) Phenotypic Screen.J Med Chem. 2017 Jan 12;60(1):180-201. doi: 10.1021/acs.jmedchem.6b01055. Epub 2016 Dec 22. J Med Chem. 2017. PMID: 28004573 Free PMC article.
-
Hif-1α/Hsf1/Hsp70 signaling pathway regulates redox homeostasis and apoptosis in large yellow croaker ( Larimichthys crocea) under environmental hypoxia.Zool Res. 2021 Nov 18;42(6):746-760. doi: 10.24272/j.issn.2095-8137.2021.224. Zool Res. 2021. PMID: 34636194 Free PMC article.
References
-
- Gunter HM, Degnan BM. Developmental expression of Hsp90, Hsp70 and HSF during morphogenesis in the vetigastropod Haliotis asinina. Dev Genes Evol. 2007;217:603–12. - PubMed
-
- Page TJ, Sikder D, Yang L, et al. Genome-wide analysis of human HSF1 signaling reveals a transcriptional program linked to cellular adaptation and survival. Mol Biosyst. 2006;2:627–39. - PubMed
-
- Li DP, Periyasamy S, Jones TJ, Sánchez ER. Heat and chemical shock potentiation of glucocorticoid receptor transactivation requires heat shock factor (HSF) activity. Modulation of HSF by vanadate and wortmannin. J Biol Chem. 2000;275:26058–65. - PubMed
-
- Baird NA, Turnbull DW, Johnson EA. Induction of the heat shock pathway during hypoxia requires regulation of heat shock factor by hypoxia-inducible factor-1. J Biol Chem. 2006;281:38675–81. - PubMed
Publication types
MeSH terms
Substances
Grants and funding
LinkOut - more resources
Full Text Sources
Other Literature Sources
Medical
