

Fatal cases of influenza A(H3N2) in children: insights from whole genome sequence analysis
- PMID: 22412998
- PMCID: PMC3295814
- DOI: 10.1371/journal.pone.0033166
Fatal cases of influenza A(H3N2) in children: insights from whole genome sequence analysis
Abstract
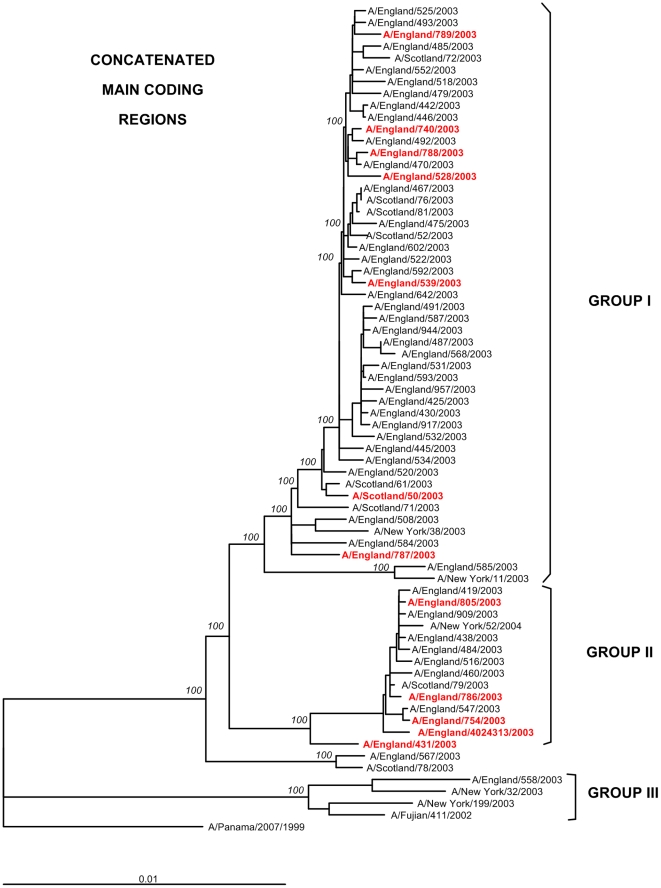
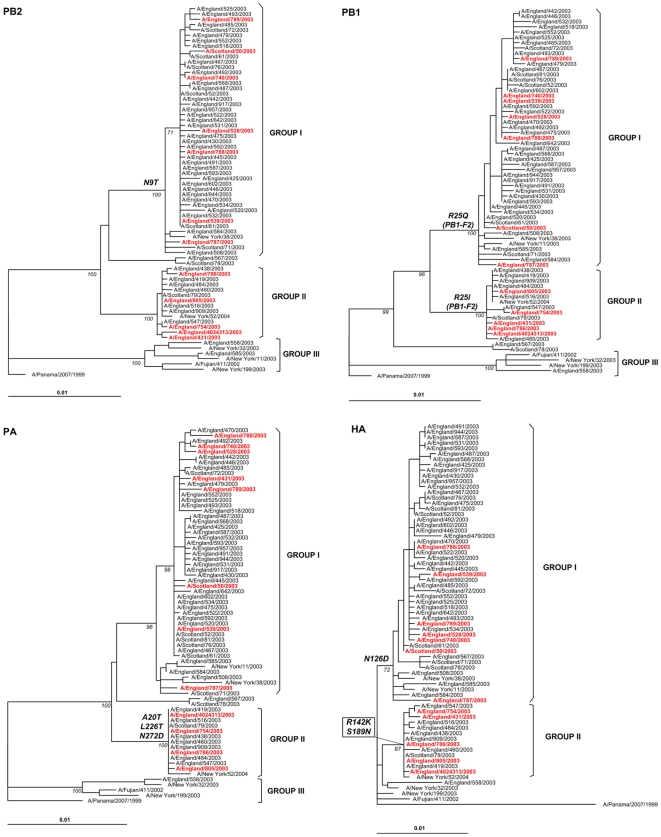
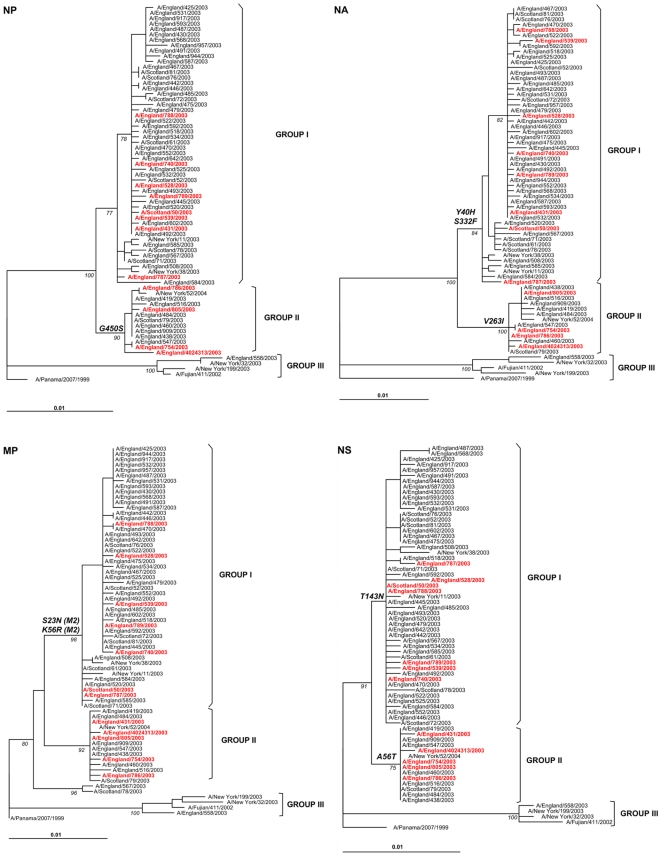
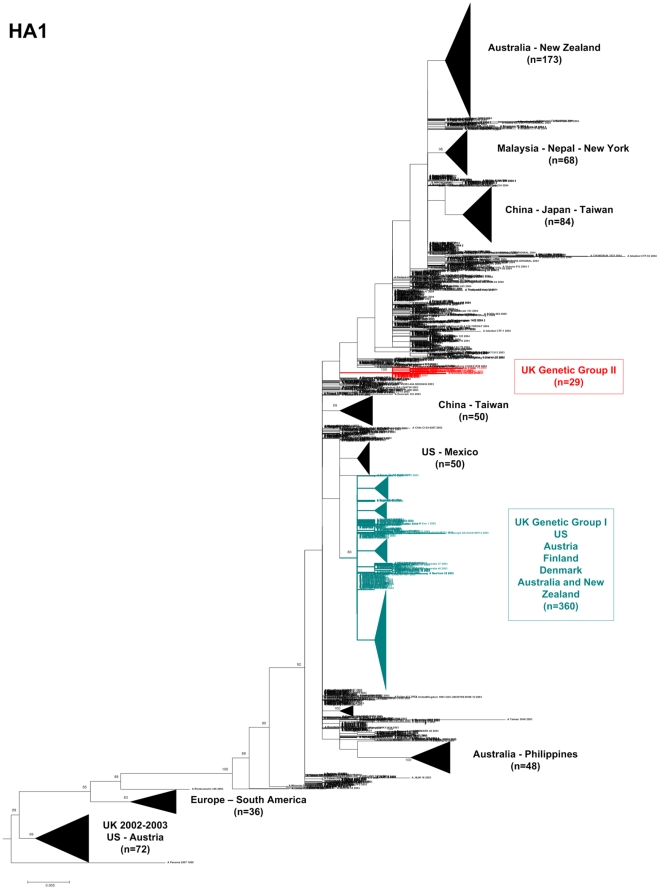
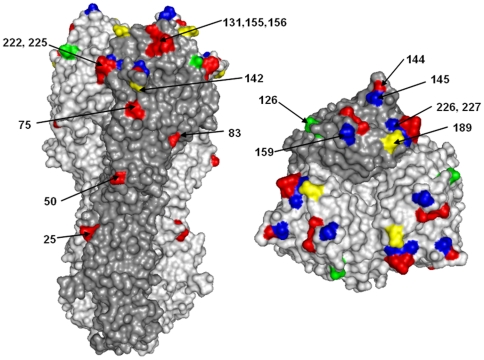
During the Northern Hemisphere winter of 2003-2004 the emergence of a novel influenza antigenic variant, A/Fujian/411/2002-like(H3N2), was associated with an unusually high number of fatalities in children. Seventeen fatal cases in the UK were laboratory confirmed for Fujian/411-like viruses. To look for phylogenetic patterns and genetic markers that might be associated with increased virulence, sequencing and phylogenetic analysis of the whole genomes of 63 viruses isolated from fatal cases and non fatal "control" cases was undertaken. The analysis revealed the circulation of two main genetic groups, I and II, both of which contained viruses from fatal cases. No associated amino acid substitutions could be linked with an exclusive or higher occurrence in fatal cases. The Fujian/411-like viruses in genetic groups I and II completely displaced other A(H3N2) viruses, but they disappeared after 2004. This study shows that two A(H3N2) virus genotypes circulated exclusively during the winter of 2003-2004 in the UK and caused an unusually high number of deaths in children. Host factors related to immune state and differences in genetic background between patients may also play important roles in determining the outcome of an influenza infection.
Conflict of interest statement
Figures

Similar articles
-
Genomewide analysis of reassortment and evolution of human influenza A(H3N2) viruses circulating between 1968 and 2011.J Virol. 2014 Mar;88(5):2844-57. doi: 10.1128/JVI.02163-13. Epub 2013 Dec 26. J Virol. 2014. PMID: 24371052 Free PMC article.
-
Predominance of influenza A(H3N2) viruses during the 2016/2017 season in Bulgaria.J Med Microbiol. 2018 Feb;67(2):228-239. doi: 10.1099/jmm.0.000668. Epub 2018 Jan 3. J Med Microbiol. 2018. PMID: 29297852
-
[An analysis on genetic characterization of HA1 gene of influenza virus subtype H3N2 circulated from 2001 to 2006 in Liaoning local area].Zhonghua Shi Yan He Lin Chuang Bing Du Xue Za Zhi. 2009 Jun;23(3):174-6. Zhonghua Shi Yan He Lin Chuang Bing Du Xue Za Zhi. 2009. PMID: 20104769 Chinese.
-
[Study on the antigenicity and HA1 gene characteristics of influenza A viruses during 2004-2008 year in China].Zhonghua Shi Yan He Lin Chuang Bing Du Xue Za Zhi. 2009 Dec;23(6):405-8. Zhonghua Shi Yan He Lin Chuang Bing Du Xue Za Zhi. 2009. PMID: 20718339 Chinese.
-
[Molecular characterization of human influenza viruses--a look back on the last 10 years].Berl Munch Tierarztl Wochenschr. 2006 Mar-Apr;119(3-4):167-78. Berl Munch Tierarztl Wochenschr. 2006. PMID: 16573207 Review. German.
Cited by
-
Serum amyloid A (SAA) is an early biomarker of influenza virus disease in BALB/c, C57BL/2, Swiss-Webster, and DBA.2 mice.Antiviral Res. 2016 Sep;133:196-207. doi: 10.1016/j.antiviral.2016.08.011. Epub 2016 Aug 11. Antiviral Res. 2016. PMID: 27523492 Free PMC article.
-
Identification of H3N2 NA and PB1-F2 genetic variants and their association with disease symptoms during the 2014-15 influenza season.Virus Evol. 2021 Jun 4;7(1):veab047. doi: 10.1093/ve/veab047. eCollection 2021 Jan. Virus Evol. 2021. PMID: 34131512 Free PMC article.
-
Genetic variations on 31 and 450 residues of influenza A nucleoprotein affect viral replication and translation.J Biomed Sci. 2020 Jan 6;27(1):17. doi: 10.1186/s12929-019-0612-z. J Biomed Sci. 2020. PMID: 31906961 Free PMC article.
-
Platelet distribution width as an useful indicator of influenza severity in children.BMC Infect Dis. 2024 Jan 2;24(1):9. doi: 10.1186/s12879-023-08890-w. BMC Infect Dis. 2024. PMID: 38166827 Free PMC article.
-
Emerging viral respiratory tract infections--environmental risk factors and transmission.Lancet Infect Dis. 2014 Nov;14(11):1113-1122. doi: 10.1016/S1473-3099(14)70831-X. Epub 2014 Sep 1. Lancet Infect Dis. 2014. PMID: 25189350 Free PMC article. Review.
References
-
- Palese P, Shaw ML. Orthomyxoviridae: The viruses and their replication. In: Fields BN, Knipe DM, Howley PM, et al., editors. Fields Virology. Fifth Edition ed. Philadelphia: Lippincott-Raven Publishers; 2007. pp. 1647–1689.
-
- Fleming DM. The contribution of influenza to combined acute respiratory infections, hospital admissions, and deaths in winter. Commun Dis Public Health. 2000;3:32–38. - PubMed
-
- Ferguson NM, Galvani AP, Bush RM. Ecological and immunological determinants of influenza evolution. Nature. 2003;422:428–433. - PubMed
-
- Smith DJ, Lapedes AS, de Jong JC, Bestebroer TM, Rimmelzwaan GF, et al. Mapping the antigenic and genetic evolution of influenza virus. Science. 2004;305:371–376. - PubMed
Publication types
MeSH terms
Substances
Associated data
- Actions
- Actions
- Actions
- Actions
- Actions
- Actions
- Actions
- Actions
- Actions
- Actions
- Actions
- Actions
- Actions
- Actions
- Actions
- Actions
- Actions
- Actions
- Actions
- Actions
- Actions
- Actions
- Actions
- Actions
- Actions
- Actions
- Actions
- Actions
- Actions
- Actions
- Actions
- Actions
- Actions
- Actions
- Actions
- Actions
- Actions
- Actions
- Actions
- Actions
- Actions
- Actions
- Actions
- Actions
- Actions
- Actions
- Actions
- Actions
- Actions
- Actions
- Actions
- Actions
- Actions
- Actions
- Actions
- Actions
- Actions
- Actions
- Actions
- Actions
- Actions
- Actions
- Actions
- Actions
- Actions
- Actions
- Actions
- Actions
- Actions
- Actions
- Actions
- Actions
- Actions
- Actions
- Actions
- Actions
- Actions
- Actions
- Actions
- Actions
- Actions
- Actions
- Actions
- Actions
- Actions
- Actions
- Actions
- Actions
- Actions
- Actions
- Actions
- Actions
- Actions
- Actions
- Actions
- Actions
- Actions
- Actions
- Actions
- Actions
- Actions
- Actions
- Actions
- Actions
- Actions
- Actions
- Actions
- Actions
- Actions
- Actions
- Actions
- Actions
- Actions
- Actions
- Actions
- Actions
- Actions
- Actions
- Actions
- Actions
- Actions
- Actions
- Actions
- Actions
- Actions
- Actions
- Actions
- Actions
- Actions
- Actions
- Actions
- Actions
- Actions
- Actions
- Actions
- Actions
- Actions
- Actions
- Actions
- Actions
- Actions
- Actions
- Actions
- Actions
- Actions
- Actions
- Actions
- Actions
- Actions
- Actions
- Actions
- Actions
- Actions
- Actions
- Actions
- Actions
- Actions
- Actions
- Actions
- Actions
- Actions
- Actions
- Actions
- Actions
- Actions
- Actions
- Actions
- Actions
- Actions
- Actions
- Actions
- Actions
- Actions
- Actions
- Actions
- Actions
- Actions
- Actions
- Actions
- Actions
- Actions
- Actions
- Actions
- Actions
- Actions
- Actions
- Actions
- Actions
- Actions
- Actions
- Actions
- Actions
- Actions
- Actions
- Actions
- Actions
- Actions
- Actions
- Actions
- Actions
- Actions
- Actions
- Actions
- Actions
- Actions
- Actions
- Actions
- Actions
- Actions
- Actions
- Actions
- Actions
- Actions
- Actions
- Actions
- Actions
- Actions
- Actions
- Actions
- Actions
- Actions
- Actions
- Actions
- Actions
- Actions
- Actions
- Actions
- Actions
- Actions
- Actions
- Actions
- Actions
- Actions
- Actions
- Actions
- Actions
- Actions
- Actions
- Actions
- Actions
- Actions
- Actions
- Actions
- Actions
- Actions
- Actions
- Actions
- Actions
- Actions
- Actions
- Actions
- Actions
- Actions
- Actions
- Actions
- Actions
- Actions
- Actions
- Actions
- Actions
- Actions
- Actions
- Actions
- Actions
- Actions
- Actions
- Actions
- Actions
- Actions
- Actions
- Actions
- Actions
- Actions
- Actions
- Actions
- Actions
- Actions
- Actions
- Actions
- Actions
- Actions
- Actions
- Actions
- Actions
- Actions
- Actions
- Actions
- Actions
- Actions
- Actions
- Actions
- Actions
- Actions
- Actions
- Actions
- Actions
- Actions
- Actions
- Actions
- Actions
- Actions
- Actions
- Actions
- Actions
- Actions
- Actions
- Actions
- Actions
- Actions
- Actions
- Actions
- Actions
- Actions
- Actions
- Actions
- Actions
- Actions
- Actions
- Actions
- Actions
- Actions
- Actions
- Actions
- Actions
- Actions
- Actions
- Actions
- Actions
- Actions
- Actions
- Actions
- Actions
- Actions
- Actions
- Actions
- Actions
- Actions
- Actions
- Actions
- Actions
- Actions
- Actions
- Actions
- Actions
- Actions
- Actions
- Actions
- Actions
- Actions
- Actions
- Actions
- Actions
- Actions
- Actions
- Actions
- Actions
- Actions
- Actions
- Actions
- Actions
- Actions
- Actions
- Actions
- Actions
- Actions
- Actions
- Actions
- Actions
- Actions
- Actions
- Actions
- Actions
- Actions
- Actions
- Actions
- Actions
- Actions
- Actions
- Actions
- Actions
- Actions
- Actions
- Actions
- Actions
- Actions
- Actions
- Actions
- Actions
- Actions
- Actions
- Actions
- Actions
- Actions
- Actions
- Actions
- Actions
- Actions
- Actions
- Actions
- Actions
- Actions
- Actions
- Actions
- Actions
- Actions
- Actions
- Actions
- Actions
- Actions
- Actions
- Actions
- Actions
- Actions
- Actions
- Actions
- Actions
- Actions
- Actions
- Actions
- Actions
- Actions
- Actions
- Actions
- Actions
- Actions
- Actions
- Actions
- Actions
- Actions
- Actions
- Actions
- Actions
- Actions
- Actions
- Actions
- Actions
- Actions
- Actions
- Actions
- Actions
- Actions
- Actions
- Actions
- Actions
- Actions
- Actions
- Actions
- Actions
- Actions
- Actions
- Actions
- Actions
- Actions
- Actions
- Actions
- Actions
- Actions
- Actions
- Actions
- Actions
- Actions
- Actions
- Actions
- Actions
- Actions
- Actions
- Actions
- Actions
- Actions
- Actions
- Actions
- Actions
- Actions
- Actions
- Actions
- Actions
- Actions
- Actions
- Actions
- Actions
- Actions
- Actions
- Actions
- Actions
- Actions
- Actions
- Actions
- Actions
- Actions
- Actions
- Actions
- Actions
- Actions
- Actions
- Actions
- Actions
- Actions
- Actions
- Actions
- Actions
- Actions
- Actions
- Actions
- Actions
- Actions
- Actions
- Actions
- Actions
- Actions
- Actions
- Actions
- Actions
- Actions
- Actions
- Actions
- Actions
- Actions
- Actions
- Actions
- Actions
- Actions
- Actions
- Actions
- Actions
- Actions
- Actions
- Actions
- Actions
- Actions
- Actions
- Actions
- Actions
- Actions
- Actions
- Actions
- Actions
- Actions
- Actions
- Actions
- Actions
- Actions
- Actions
- Actions
- Actions
- Actions
- Actions
- Actions
- Actions
- Actions
- Actions
- Actions
- Actions
- Actions
- Actions
- Actions
- Actions
- Actions
- Actions
- Actions
- Actions
- Actions
- Actions
- Actions
- Actions
- Actions
- Actions
- Actions
- Actions
- Actions
- Actions
- Actions
- Actions
- Actions
- Actions
- Actions
- Actions
- Actions
- Actions
- Actions
- Actions
- Actions
- Actions
- Actions
- Actions
- Actions
- Actions
- Actions
- Actions
- Actions
- Actions
- Actions
- Actions
- Actions
- Actions
- Actions
- Actions
- Actions
- Actions
- Actions
- Actions
- Actions
- Actions
- Actions
- Actions
- Actions
- Actions
- Actions
- Actions
- Actions
- Actions
- Actions
- Actions
- Actions
- Actions
- Actions
- Actions
- Actions
- Actions
- Actions
- Actions
- Actions
- Actions
- Actions
- Actions
- Actions
- Actions
- Actions
- Actions
- Actions
- Actions
- Actions
- Actions
- Actions
- Actions
- Actions
- Actions
- Actions
- Actions
- Actions
- Actions
- Actions
- Actions
- Actions
- Actions
- Actions
- Actions
- Actions
- Actions
- Actions
- Actions
- Actions
- Actions
- Actions
- Actions
- Actions
- Actions
- Actions
- Actions
- Actions
- Actions
- Actions
- Actions
- Actions
- Actions
- Actions
- Actions
- Actions
- Actions
- Actions
- Actions
- Actions
- Actions
- Actions
- Actions
- Actions
- Actions
- Actions
- Actions
- Actions
- Actions
- Actions
- Actions
- Actions
- Actions
- Actions
- Actions
- Actions
- Actions
- Actions
- Actions
- Actions
- Actions
- Actions
- Actions
- Actions
- Actions
- Actions
- Actions
- Actions
- Actions
- Actions
- Actions
- Actions
- Actions
- Actions
- Actions
- Actions
- Actions
- Actions
- Actions
- Actions
- Actions
Grants and funding
LinkOut - more resources
Full Text Sources
Medical
