. 2012;7(3):e32803.
doi: 10.1371/journal.pone.0032803. Epub 2012 Mar 5.

Morbillivirus glycoprotein expression induces ER stress, alters Ca2+ homeostasis and results in the release of vasostatin

Affiliations

Morbillivirus glycoprotein expression induces ER stress, alters Ca2+ homeostasis and results in the release of vasostatin

Jean-Marc Brunner et al. PLoS One. 2012.

Abstract

Although the pathology of Morbillivirus in the central nervous system (CNS) is well described, the molecular basis of neurodegenerative events still remains poorly understood. As a model to explore Morbillivirus-mediated CNS dysfunctions, we used canine distemper virus (CDV) that we inoculated into two different cell systems: a monkey cell line (Vero) and rat primary hippocampal neurons. Importantly, the recombinant CDV used in these studies not only efficiently infects both cell types but recapitulates the uncommon, non-cytolytic cell-to-cell spread mediated by virulent CDVs in brain of dogs. Here, we demonstrated that both CDV surface glycoproteins (F and H) markedly accumulated in the endoplasmic reticulum (ER). This accumulation triggered an ER stress, characterized by increased expression of the ER resident chaperon calnexin and the proapoptotic transcription factor CHOP/GADD 153. The expression of calreticulin (CRT), another ER resident chaperon critically involved in the response to misfolded proteins and in Ca(2+) homeostasis, was also upregulated. Transient expression of recombinant CDV F and H surface glycoproteins in Vero cells and primary hippocampal neurons further confirmed a correlation between their accumulation in the ER, CRT upregulation, ER stress and disruption of ER Ca(2+) homeostasis. Furthermore, CDV infection induced CRT fragmentation with re-localisation of a CRT amino-terminal fragment, also known as vasostatin, on the surface of infected and neighbouring non-infected cells. Altogether, these results suggest that ER stress, CRT fragmentation and re-localization on the cell surface may contribute to cytotoxic effects and ensuing cell dysfunctions triggered by Morbillivirus, a mechanism that might potentially be relevant for other neurotropic viruses.


Conflict of interest statement

Competing Interests: The authors have declared that no competing interests exist.

Figures

Figure 1
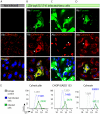
Figure 1. Infection of Vero cells by rgA75/17-V (CDV) induces ER stress.
(A, B, C, D) Representative photomicrographs of non-infected Vero cells (A) and infected with a Vero cell-adapted canine distemper virus (CDV) strain (rgA75/17-V). The former recombinant CDV expresses the enhanced green fluorescence protein (e-GFP) for easier identification of infected cells (B, C, D). Cultures were infected 1 day after seeding. Cells were then fixed and permeabilized and subsequently analysed by immunofluorescence at 24 hours (A, B and D) or 48 hours (C) after infection. Antibodies against the protein F of CDV (F), calreticulin, CHOP-GADD and Calnexin are as indicated in the panels. Merged images are shown on bottom panels, including labelling with 4′6-diamidino-2-phenylindole (DAPI, blue). Scale bar, 30 µm. Calreticulin and calnexin expression are increased in infected cells that expressed the F protein (B and D) and at 48 hours post-infection, infected cells also express strongly the nuclear proapoptotic CHOP/GADD 153 (C). (E) Increase of CRT, CHOP/GADD 153 and calnexin during culture infection, as determined by flow cytofluorimetry. Each sample was analysed in triplicate on three separate experiments, and one representative experiment is shown here.
Figure 2
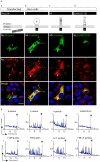
Figure 2. CDV F and H surface glycoproteins accumulate in the ER, induce increased CRT expression and cause changes in Ca2+ homeostasis in Vero cells.
(A) Vero cells were transiently transfected with plasmids expressing CDV protein N (Aa), F (Ab), H (Ac) or the SLAM/CD150 construct (Ad). Top row: schematic representation of their respective protein structures. Top panels: immunofluorescence at 24 hours post-transfection for N, F, H, and SLAM/CD150 (in green). Middle panels: immunofluorescence for CRT (in red). Bottom panels show merged images, including nuclear staining with DAPI (in blue). The viral F and H glycoproteins accumulated within the ER lumen and co-localize with strongly expressed CRT (empty white arrow heads). In contrast, cytosolic N CDV protein is not localized to the ER and does not induce CRT upregulation. (Compare empty white arrow head corresponding to N CDV protein, and white arrow head indicating CRT). SLAM/CD150 does not induce CRT upregulation. Scale bars, 30 µm. The immunofluorescence assays were performed in fixed and permeabilized cells. (B) Investigation of Ca2+ homeostasis. Vero cells were co-transfected with GFP-aequorin (GA) and different combination of the CDV glycoproteins and SLAM/CD150, as indicated above each panel. 24 hours after transfection, 5 mM Coelenterazine was added and photon counting started 60 minutes later. At the end of the experiment 2 mM of ionomycin was added to completely empty ER Ca2+ stores, followed by high Ca2+ solution (10 mM, shown by the last peak “High/Ca2+” and represented by an asterisk (*). This enabled an estimation of GA expression levels and allows normalization between the acquisitions.
Figure 3
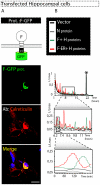
Figure 3. CDV F and H surface glycoproteins accumulate in the ER, induce increased CRT expression and cause changes in Ca2+ homeostasis in primary hippocampal cells.
(A) Top panel: Drawing representing the F-GFP construct. F-GFP was transfected into primary hippocampal neurons. Bottom panels: visualisation of cells expressing F (green fluorescence) and CRT (red fluorescence). For CRT staining, immunofluorescence was performed in fixed and permeabilized cells. The two panels are merged together with DAPI staining in the very bottom panel. As in Vero cells, this chimera induced an increased CRT expression. Scale bars, 30 µm. (B) Investigation of Ca2+ homeostasis. Primary hippocampal neurons were co-transfected with empty vector and the CDV protein-expressing vectors as indicated in the top panel. Below, the graphs exhibit combined curves of Ca2+ release in the cytosol upon expression of the indicated proteins. The bottom graph is a magnification of the middle graph, which is a magnification of the top graph. All samples were analysed in triplicate on three separate experiments, and one representative experiment is shown here. The recorded Ca2+ responses are consistent with the ER F and H protein accumulation and subsequent ER stress observed in Vero cells.
Figure 4
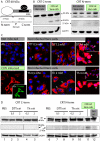
Figure 4. CDV infection of Vero cells causes CRT fragmentation with vasostatin formation.
(A) Schematic representation of the 60 kDa CRT protein. The globular 27 kDa N-terminal domain (N-term) is the most important antigenic site of the protein. This domain, as well as the P domain, possesses the chaperon function. C-terminal domain (C-term) is important for Ca2+ storage and possesses the KDEL ER retention signal. P and C-terminal domains have together an estimated mass of 30 kDa. (B) The Vero cells were either left non-infected or infected with CDV. At 48 h post-infection cells were lysed and analyzed by Western blot using C-terminal-specific (left) or N-terminal-specific (right) antibodies. Note the C-terminal 30 kDa fragment, and the 27 kDa N-terminal fragment. GAPDH is used as an internal control. (C) Impact of the ER stress inducing drugs dithiothreitol (DTT) and thapsigargin (Th) on CRT expression during CDV infection. Red fluorescence in all panels corresponds to CRT immunostaining, which increases in a DTT concentration-dependent manner (top panels) or in a thapsigargin concentration-dependent manner (white arrow heads). For comparison, calreticulin staining is shown in infected cells probed by immunostaining of the F protein (bottom left and insert panels). Immunofluorescence analyses were performed in fixed and permeabilized cells. (D) Western blot using the antibody recognizing either the N- terminal domain of CRT (27 kDa, right panel) or the C- terminal domain (30 kDa; left panel). Both antibodies recognize the full-length CRT (top line, 60 kDa). Cellular extracts come from Vero cells exposed to DTT or thapsigargin (Th), or CDV infected as indicated. GAPDH was used as an internal control. CRT cleavage was specifically mediated by CDV infection (line 11) and not by exposure to DTT or thapsigargin.
Figure 5
Figure 5. CRT N-terminal fragments are re-localized at the cell surface.
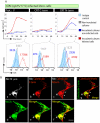
(A) The kinetics of the appearance of the F protein and CRT C-terminal and N-terminal fragments at the surface of infected Vero cells were monitored by flow cytofluorimetry using the corresponding specific antibodies. Control cell cultures were not infected (grey lines). From infected cell cultures, infected cells (red line; GFP-positive) and non-infected cells (blue line, GFP-negative) were identified by virus-encoded GFP fluorescence. Cell surface immuno-labelling of cells (unifxed and nonpermeablized) with F and CRT C-terminal and N-terminal were performed with specific antibodies as indicated at the top of the panels. The mean fluorescence intensity (MFI) of the labelling was determined within each cell population regularly over 48 hours of infection (top panels). The three bottom panels represent the distribution of the MFI within each population at 48 hours post-infection. Here is shown one representative experiment out of three independent experiments. (B) Membrane localisation of CRT N-terminal fragment following CDV infection. At 24 hours post-infection in Vero cells, cultures were immuno-labelled for the viral F protein to identify infected cells (Ba; fluorochrome: FITC), C-terminal specific anti-CRT antibody (Bb; fluorochrome: CY3), and N-terminal specific anti-CRT antibody (Bc; fluorochrome: CY5). In panel Bd, cell membranes were stained with alexa-405-conjugated wheat germ agglutinin (WGA). The merges images b and d (Be) reveal little co-localisation of CRT C-terminal fragment with the cell surface, while the merges images c and d (Bf) indicate partial surface localization of the CRT N-terminal fragment. Panel g is a merge between images b and c. Scale bar, 30 µm. Immunofluorescence analyses were performed in fixed and permeabilized cells.
Figure 6
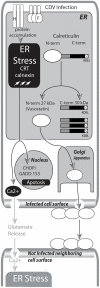
Figure 6. Mechanistic model of neurodegenerative processes induced by CDV infection.
The F and H CDV proteins are accumulating in the ER. This event induces an early ER stress event. In early ER stress, the quantities of CRT chaperon increase, the Ca2+ homeostasis is altered and Ca2+ is depleted from ER stores. Increase of cytosolic Ca2+ can have as consequence a glutamate release during CDV infection as previously described . Glutamate release could induce, in the neighbouring neurons, Ca2+ entry followed by an ER stress induction . During ER stress, the infected cells show enhance expression of the chaperons CRT, calnexin and GRP94 and relocalisation of the transcription factor ATF-6 in the nucleus followed by the expression of the proapoptotic factor CHOP/GADD 153. More importantly, infected cells show CRT fragmentation in a CDV-dependent manner. C-terminal fragments are retained in the ER by the KDEL signal whereas CRT N-terminal fragments are present after 24 hours at the cell surface. Cell surface exposition of CRT N-terminal fragment may contribute to CDV-mediated neurodegenerative auto-immunity. In grey italic are events described in previous publications.

Similar articles

Cited by

References

    1. Vandevelde M, Zurbriggen A. Demyelination in canine distemper virus infection: a review. Acta Neuropathol (Berl) 2005;109:56–68. - PubMed
    1. Beineke A, Puff C, Seehusen F, Baumgartner W. Pathogenesis and immunopathology of systemic and nervous canine distemper. Vet Immunol Immunopathol. 2009;127:1–18. - PubMed
    1. Brunner JM, Plattet P, Majcherczyk P, Zurbriggen A, Wittek R, et al. Canine distemper virus infection of primary hippocampal cells induces increase in extracellular glutamate and neurodegeneration. J Neurochem. 2007;103:1184–1195. - PubMed
    1. Kaufman RJ. Stress signaling from the lumen of the endoplasmic reticulum: coordination of gene transcriptional and translational controls. Genes Dev. 1999;13:1211–1233. - PubMed
    1. Malhotra JD, Kaufman RJ. The endoplasmic reticulum and the unfolded protein response. Semin Cell Dev Biol. 2007;18:716–731. - PMC - PubMed

Publication types

MeSH terms