. 2012 May 9;18(1):647-58.
doi: 10.2119/molmed.2011.00222.

Prime-boost vaccination with rBCG/rAd35 enhances CD8⁺ cytolytic T-cell responses in lesions from Mycobacterium tuberculosis-infected primates

Affiliations

Prime-boost vaccination with rBCG/rAd35 enhances CD8⁺ cytolytic T-cell responses in lesions from Mycobacterium tuberculosis-infected primates

Sayma Rahman et al. Mol Med. .

Abstract

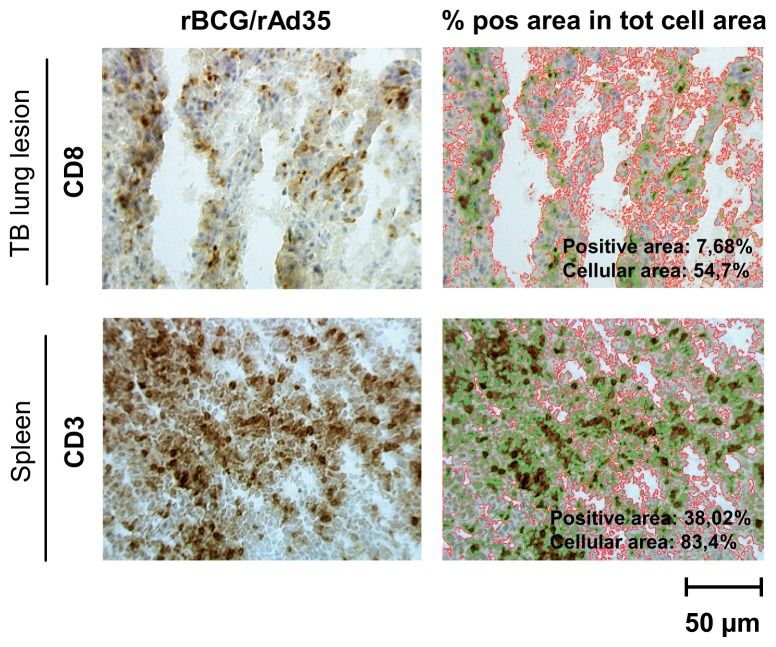
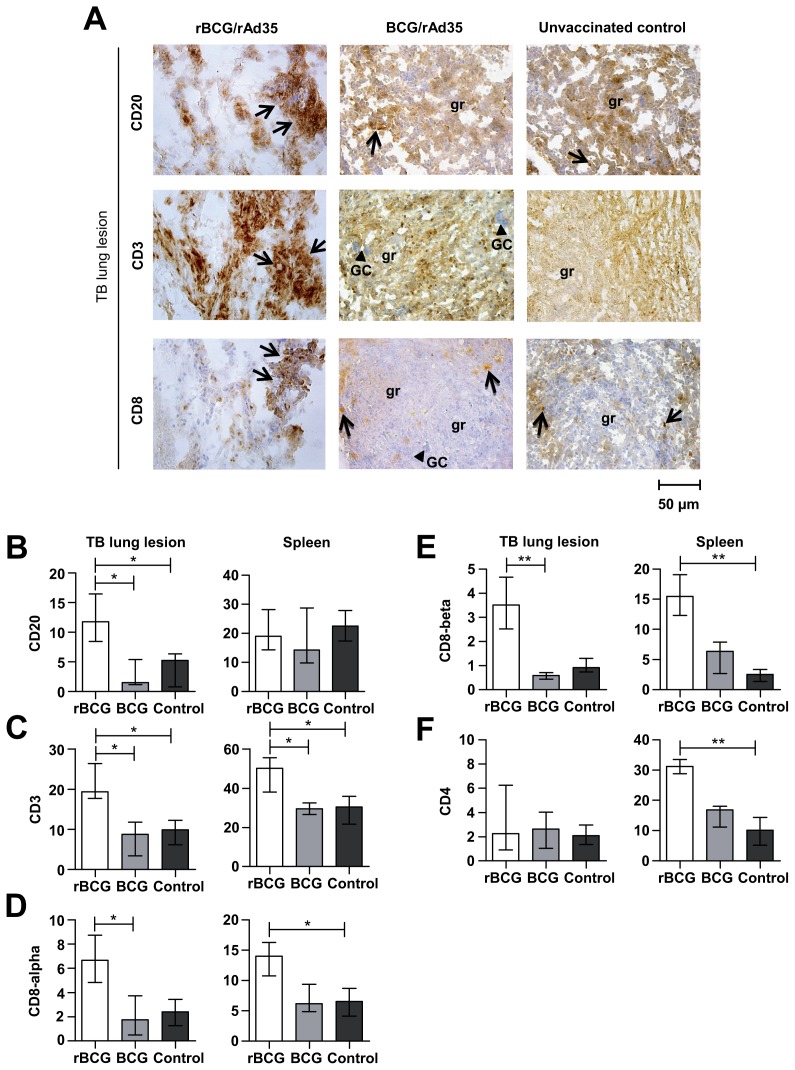
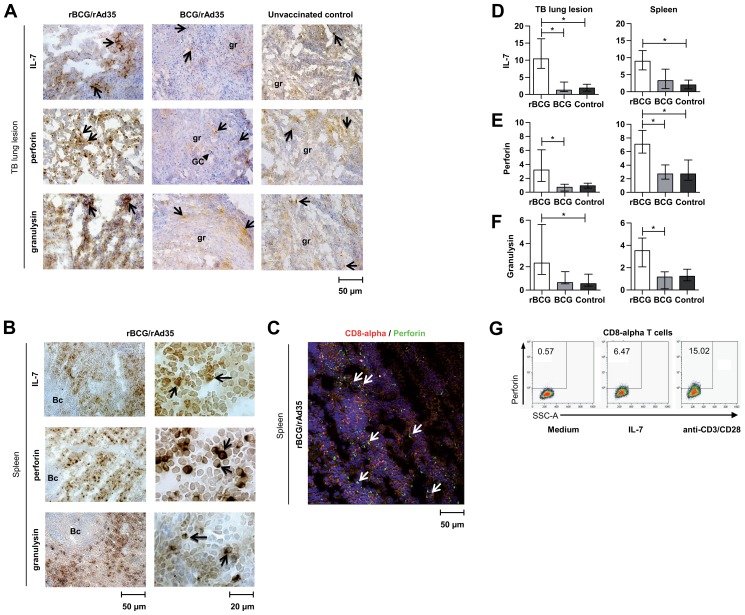
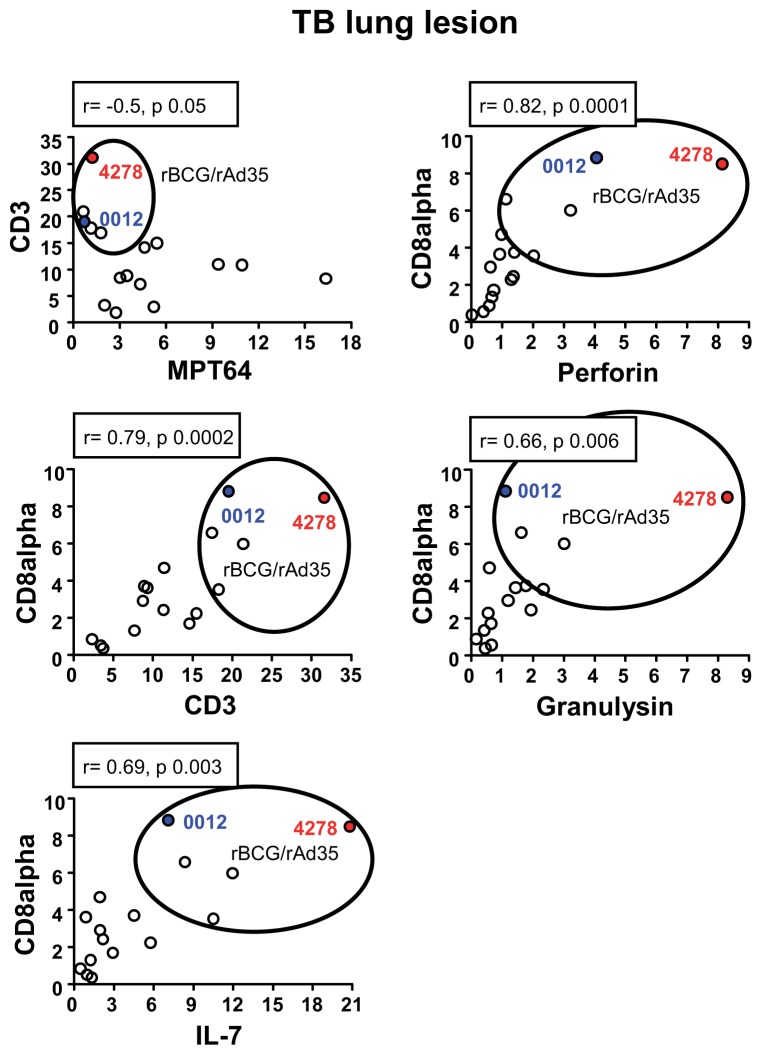
To prevent the global spread of tuberculosis (TB) infection, a novel vaccine that triggers potent and long-lived immunity is urgently required. A plasmid-based vaccine has been developed to enhance activation of major histocompatibility complex (MHC) class I-restricted CD8⁺ cytolytic T cells using a recombinant Bacille Calmette-Guérin (rBCG) expressing a pore-forming toxin and the Mycobacterium tuberculosis (Mtb) antigens Ag85A, 85B and TB10.4 followed by a booster with a nonreplicating adenovirus 35 (rAd35) vaccine vector encoding the same Mtb antigens. Here, the capacity of the rBCG/rAd35 vaccine to induce protective and biologically relevant CD8⁺ T-cell responses in a nonhuman primate model of TB was investigated. After prime/boost immunizations and challenge with virulent Mtb in rhesus macaques, quantification of immune responses at the single-cell level in cryopreserved tissue specimen from infected organs was performed using in situ computerized image analysis as a technological platform. Significantly elevated levels of CD3⁺ and CD8⁺ T cells as well as cells expressing interleukin (IL)-7, perforin and granulysin were found in TB lung lesions and spleen from rBCG/rAd35-vaccinated animals compared with BCG/rAd35-vaccinated or unvaccinated animals. The local increase in CD8⁺ cytolytic T cells correlated with reduced expression of the Mtb antigen MPT64 and also with prolonged survival after the challenge. Our observations suggest that a protective immune response in rBCG/rAd35-vaccinated nonhuman primates was associated with enhanced MHC class I antigen presentation and activation of CD8⁺ effector T-cell responses at the local site of infection in Mtb-challenged animals.


Figures

Figure 1
Figure 1
Protein expression in NHP lung and spleen tissue was quantified using in situ computerized image analysis of immunohistochemistry data. Immunohistochemistry images (left panel) illustrate positive immunostaining for CD8α+ T cells or CD3+ T cells (brown) in Mtb-infected tissue obtained from an rBCG/rAd35-vaccinated animal. The threshold values for the positive staining (green contour line) and the total cell area (red/orange contour line), illustrated in the overlay image (right panel), was set using a digital image analysis system including a highly sensitive Qwin 550 software. The data are presented in field statistics as the total area measured, intensity, positive area and cellular area. A mean value of the percent positive area of the total cell area in the tissue was quantified in 10–40 high-power fields and plotted in separate graphs. Magnification 125×.
Figure 2
Figure 2
Vaccination with rBCG/rAd35 resulted in reduced collagen type I deposition as well as reduced Mtb-specific antigen load in lung and spleen from Mtb-infected animals. (A) Representative immunohistochemical images demonstrate expression and distribution of collagen type I (upper panel) and the Mtb-specific antigen MPT64 (lower panel) in pulmonary TB lesions obtained from the rBCG/rAd35 and BCG/rAd35 vaccine groups as well as the unvaccinated control. Granulomatous areas (gr) with the presence of characteristic giant cells (GC; arrowheads) are shown in the TB lesions. Arrows indicate positive cells (brown), whereas negative cells (blue) were counterstained with hematoxylin. Granulomatous lung tissue contained high levels of collagen type I and MPT64. The median cellularity obtained in the collagen type I staining is also shown in the upper panel. Magnification 125×. (B) The higher-magnification image (600×) reveals cytoplasmic expression of MPT64 and CD68 in cells present in the granulomatous area of a pulmonary TB lesion from an rBCG/rAd35-vaccinated animal. In situ computerized image analysis of collagen type I (C), MPT64 (D) and CD68 (E) expression in TB lung lesion and spleen tissue of rBCG (rBCG/rAd35) or BCG (BCG/rAd35) vaccinated and control (unvaccinated) animals is shown. Data are presented as percent positive area of the total cell area, and the median ± IQR from n = 5–6 animals/group is shown. Statistical significance of differences in protein expression was determined by a nonparametric Kruskal-Wallis test. *P < 0.05, **P < 0.01.
Figure 3
Figure 3
Vaccination with rBCG/rAd35 resulted in elevated levels of different lymphocyte populations in lung and spleen from Mtb-infected animals. (A) Microscopic images of CD20+ B cells (upper panel) and CD3+ (middle panel) and CD8α T cells (lower panel) in TB lung lesions from the rBCG/rAd35 and BCG/rAd35 vaccine groups as well as the unvaccinated control. Immunohistochemical staining was performed, and granulomatous areas (gr) with the presence of characteristic giant cells (GC; arrowheads) are shown in the TB lesions. Arrows indicate positive cells and cell infiltrates (brown), whereas negative cells (blue) are counterstained with hematoxylin. Magnification 125×. Protein expression of CD20+ B cells (B), CD3+ T cells (C), CD8α+ T cells (D), CD8β+ T cells (E), and CD4+ T cells (F) was assessed using computerized image analysis to determine the median protein expression (± IQR) in lung lesions and spleen tissues among rBCG (rBCG/rAd35) or BCG (BCG/rAd35) vaccinated and control (unvaccinated) animals. The data from n = 5–6 animals/group are presented as percent positive area of the total cell area. Statistical significance of differences in protein expression was determined by a nonparametric Kruskal-Wallis test. *P < 0.05, **P < 0.01.
Figure 4
Figure 4
Vaccination with rBCG/rAd35 resulted in induction of IL-7 as well as perforin and granulysin protein in lung and spleen from Mtb-infected animals. (A) Representative immunohistochemical images illustrate IL-7 (upper panel), perforin (middle panel) and granulysin (lower panel) expression in TB lung lesions from the rBCG/rAd35 and BCG/rAd35 vaccine groups as well as the unvaccinated control. Granulomatous areas (gr) with the presence of characteristic giant cells (GC; arrowheads) are shown in the TB lesions. Arrows indicate positive cells (brown), whereas negative cells (blue) were counterstained with hematoxylin. The expression of IL-7, perforin and granulysin were very low in the granulomatous areas. Magnification 125×. (B) Images of IL-7, perforin and granulysin expression in spleen from an rBCG/rAd35-vaccinated animal. These proteins were rarely found in the B-cell areas (Bc) of the spleen. Magnification 125×. Higher magnification (600×) shows cell-associated (high-intensity) and extracellular (low-intensity) expression of IL-7 in splenocytes as well as granular and polarized expression of granule-associated effector molecules in splenic lymphocytes. (C) Two-color staining demonstrates high colocalization of perforin (green; Alexa-488) and CD8+ T cells (red; Alexa-594) in spleen tissue. White arrows indicate double-positive cells. In situ computerized image analysis was used to assess the median expression (± IQR) of IL-7 (D), perforin (E) and granulysin protein (F) in lung lesions and spleen tissues among the different groups as indicated. The results from n = 5–6 animals/group are presented as percent positive area of the total cell area, and statistical significance of differences in protein expression was determined by a nonparametric Kruskal-Wallis test. (G) The frequency of perforin-positive cells among CD8+ T cells was detected by flow cytometric analysis after in vitro IL-7 short-term stimulation of PBMCs from NHPs for 6 h. Representative data from one of three animals are shown. *P < 0.05.
Figure 5
Figure 5
Low levels of Mtb-specific antigen MPT64 correlates with an elevated proportion of CD3+/CD8+ T cells and enhanced cytolytic T-cell responses in TB lung lesions from Mtb-infected animals. Correlation analyses were performed to assess the associations between the following: Mtb antigen load (MPT64) and CD3+ T cells; CD3+ T cells and CD8+ T cells; and CD8+ T cells and IL-7, perforin or granulysin in the lung tissue of Mtb-infected animals. Data from animals in the rBCG/rAd35-vaccinated group are encircled in the graphs. In addition, data from two animals in the rBCG/rAd35-vaccinated group that presented polyfunctional T-cell responses in blood (13) are given in red (ID 4278) and blue (ID 0012) symbols. In the correlation graphs, data from individual animals (n = 16) are presented as percent positive area of total cell area, and the correlation between indicated markers were determined using Spearman’s correlation test. A value of r = 1 for the correlation coefficient (rs) indicates a perfect correlation, whereas r = −1 indicates a perfect negative or inverse correlation.
Figure 6
Figure 6
Survival of Mtb-infected animals was associated with enhanced CD8+ CTL responses and reduced Mtb antigen load, particularly at the site of infection in the lung. Immune responses induced in TB lung lesion and spleen of the S = survival group as compared with the D = deceased group. The different prime-boost regimens are indicated in red (rBCG/rAd35), blue (BCG/rAd35) and green (unvaccinated control) symbols. Animals in the survival group (n = 10) remained alive until the end of the trial (wks 23–24), whereas animals in the deceased group (n = 8) died from their TB disease during the course of the trial (wks 10–18). Lung biopsies from one rBCG/rAd35- and one BCG/rAd35-vaccinated NHP are missing and thus the number of animals in the survival group is lower in lung compared with spleen. The median protein expression of Mtb antigen (MPT64), immune cells (CD68, CD20, CD3, CD8 and CD4) and effector molecules (IL-7, perforin and granulysin) are presented as percent positive area of the total cell area. Statistical significance of differences in protein expression was determined by a non-parametric Kruskal-Wallis test.

Similar articles

Cited by

References

    1. Andersen P, Doherty TM. The success and failure of BCG: implications for a novel tuberculosis vaccine. Nat Rev. 2005;3:656–62. - PubMed
    1. Flynn JL, Chan J. Immunology of tuberculosis. Annu Rev Immunol. 2001;19:93–129. - PubMed
    1. Stenger S, et al. Differential effects of cytolytic T cell subsets on intracellular infection. Science. 1997;276:1684–7. - PubMed
    1. Woodworth JS, Wu Y, Behar SM. Mycobacterium tuberculosis-specific CD8+ T cells require perforin to kill target cells and provide protection in vivo. J Immunol. 2008;181:8595–603. - PMC - PubMed
    1. Stenger S, et al. An antimicrobial activity of cytolytic T cells mediated by granulysin. Science. 1998;282:121–5. - PubMed

Publication types

MeSH terms