Characteristics of the secondary bubble cluster produced by an electrohydraulic shock wave lithotripter
- PMID: 22390990
- PMCID: PMC3572244
- DOI: 10.1016/j.ultrasmedbio.2011.12.022
Characteristics of the secondary bubble cluster produced by an electrohydraulic shock wave lithotripter
Abstract
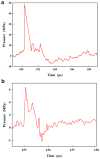
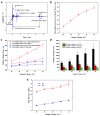
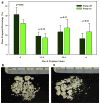
This study investigated the characteristics of the secondary bubble cluster produced by an electrohydraulic lithotripter using high-speed imaging and passive cavitation detection techniques. The results showed that (i) the discrepancy of the collapse time between near a flat rigid boundary and in a free field of the secondary bubble cluster was not as significant as that by the primary one; (ii) the secondary bubble clusters were small but in a high bubble density and nonuniform in distribution, and they did not expand and aggregate significantly near a rigid boundary; and (iii) the corresponding bubble collapse was weaker with few microjet formation and bubble rebound. By applying a strong suction flow near the electrode tip, the production of the secondary shock wave (SW) and induced bubble cluster could be disturbed significantly, but without influence on the primary ones. Consequently, stone fragmentation efficiency was reduced from 41.2 ± 7.1% to 32.2 ± 3.5% after 250 shocks (p < 0.05). Altogether, these observations suggest that the secondary bubble cluster produced by an electrohydraulic lithotripter may contribute to its ability for effective stone fragmentation.
Copyright © 2012 World Federation for Ultrasound in Medicine & Biology. Published by Elsevier Inc. All rights reserved.
Figures


Similar articles
-
Reduction of bubble cavitation by modifying the diffraction wave from a lithotripter aperture.J Endourol. 2012 Aug;26(8):1075-84. doi: 10.1089/end.2011.0671. Epub 2012 Mar 26. J Endourol. 2012. PMID: 22332839 Free PMC article.
-
Quantitative measurements of acoustic emissions from cavitation at the surface of a stone in response to a lithotripter shock wave.J Acoust Soc Am. 2006 Apr;119(4):1929-32. doi: 10.1121/1.2177589. J Acoust Soc Am. 2006. PMID: 16642802
-
Transient oscillation of cavitation bubbles near stone surface during electrohydraulic lithotripsy.J Endourol. 1997 Feb;11(1):55-61. doi: 10.1089/end.1997.11.55. J Endourol. 1997. PMID: 9048300
-
Shock wave sensors: I. Requirements and design.J Lithotr Stone Dis. 1991 Jan;3(1):3-17. J Lithotr Stone Dis. 1991. PMID: 10149140 Review.
-
Cavitation microjets as a contributory mechanism for renal calculi disintegration in ESWL.J Urol. 1988 Dec;140(6):1587-90. doi: 10.1016/s0022-5347(17)42132-x. J Urol. 1988. PMID: 3057239 Review.
References
-
- Chaussy C, Fuchs GJ. Current state and future developments of noninvasive treatment of human urinary stones with extracorporeal shock wave lithotripsy. J Urol. 1989;141:782–792. - PubMed
-
- Chaussy C, Schmiedt E, Jocham D. Extracorporeal shock wave lithotripsy. In: Chaussy C, editor. New aspects in the treatment of kidney stone disease. Basel: Karger; 1982.
-
- Choi MJ, Coleman AJ, Saunders JE. The influence of fluid properties and pulse amplitude on bubble dynamics in the field of a shock-wave lithotripter. Phys Med Biol. 1993;38:1561–1573. - PubMed
-
- Coleman AJ, Choi MJ, Saunders JE, Leighton TG. Acoustic emission and sonoluminescence due to cavitation at the beam focus of an electrohydraulic shock wave lithotripter. Ultrasound Med Biol. 1992;18:267–281. - PubMed
-
- Coleman AJ, Saunders JE. A survey of the acoustic output of commercial extracorporeal shock wave lithotripters. J Acoust Soc Am. 1989;15:213–227. - PubMed
Publication types
MeSH terms
Grants and funding
LinkOut - more resources
Full Text Sources

