

Chromatin-modifying enzymes as modulators of reprogramming
- PMID: 22388813
- PMCID: PMC3501145
- DOI: 10.1038/nature10953
Chromatin-modifying enzymes as modulators of reprogramming
Abstract
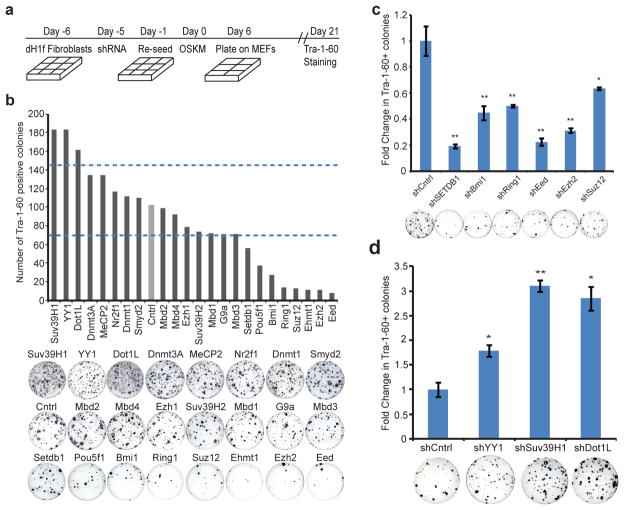
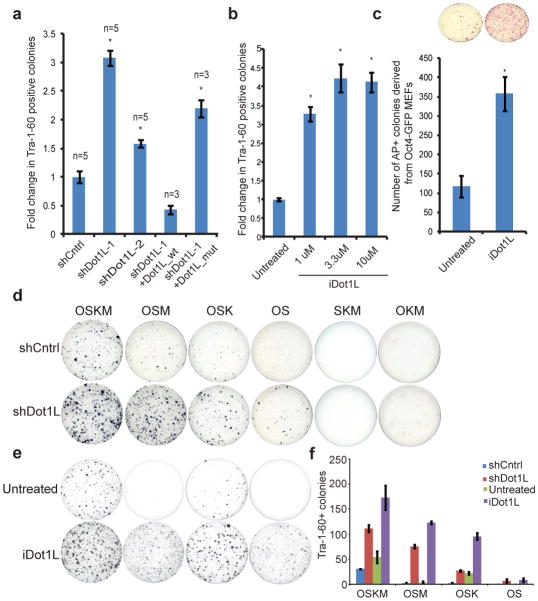
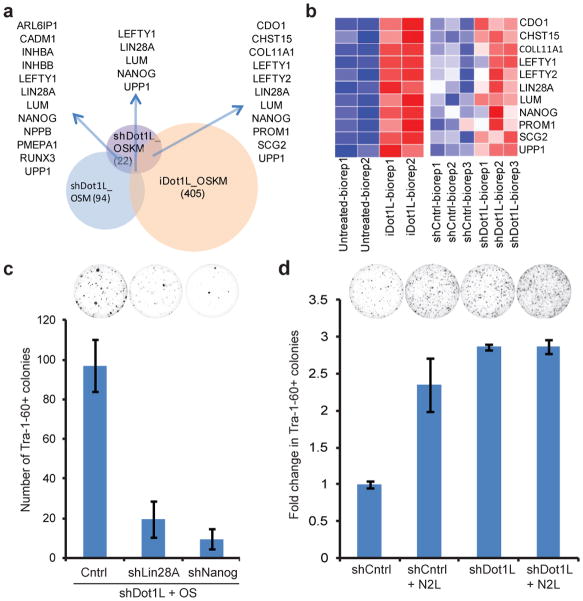
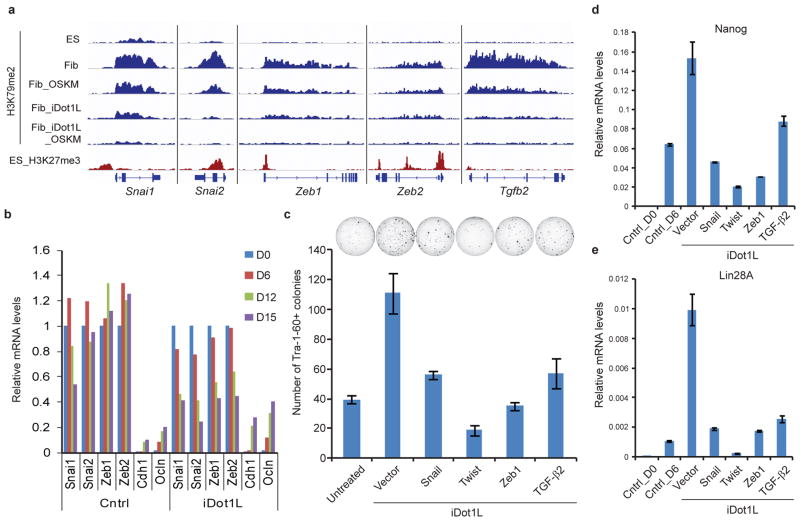
Generation of induced pluripotent stem cells (iPSCs) by somatic cell reprogramming involves global epigenetic remodelling. Whereas several proteins are known to regulate chromatin marks associated with the distinct epigenetic states of cells before and after reprogramming, the role of specific chromatin-modifying enzymes in reprogramming remains to be determined. To address how chromatin-modifying proteins influence reprogramming, we used short hairpin RNAs (shRNAs) to target genes in DNA and histone methylation pathways, and identified positive and negative modulators of iPSC generation. Whereas inhibition of the core components of the polycomb repressive complex 1 and 2, including the histone 3 lysine 27 methyltransferase EZH2, reduced reprogramming efficiency, suppression of SUV39H1, YY1 and DOT1L enhanced reprogramming. Specifically, inhibition of the H3K79 histone methyltransferase DOT1L by shRNA or a small molecule accelerated reprogramming, significantly increased the yield of iPSC colonies, and substituted for KLF4 and c-Myc (also known as MYC). Inhibition of DOT1L early in the reprogramming process is associated with a marked increase in two alternative factors, NANOG and LIN28, which play essential functional roles in the enhancement of reprogramming. Genome-wide analysis of H3K79me2 distribution revealed that fibroblast-specific genes associated with the epithelial to mesenchymal transition lose H3K79me2 in the initial phases of reprogramming. DOT1L inhibition facilitates the loss of this mark from genes that are fated to be repressed in the pluripotent state. These findings implicate specific chromatin-modifying enzymes as barriers to or facilitators of reprogramming, and demonstrate how modulation of chromatin-modifying enzymes can be exploited to more efficiently generate iPSCs with fewer exogenous transcription factors.
Figures
Similar articles
-
Proteomic and genomic approaches reveal critical functions of H3K9 methylation and heterochromatin protein-1γ in reprogramming to pluripotency.Nat Cell Biol. 2013 Jul;15(7):872-82. doi: 10.1038/ncb2768. Epub 2013 Jun 9. Nat Cell Biol. 2013. PMID: 23748610 Free PMC article.
-
Ezh2 mediated H3K27me3 activity facilitates somatic transition during human pluripotent reprogramming.Sci Rep. 2015 Feb 4;5:8229. doi: 10.1038/srep08229. Sci Rep. 2015. PMID: 25648270 Free PMC article.
-
Early-stage epigenetic modification during somatic cell reprogramming by Parp1 and Tet2.Nature. 2012 Aug 30;488(7413):652-5. doi: 10.1038/nature11333. Nature. 2012. PMID: 22902501 Free PMC article.
-
Going up the hill: chromatin-based barriers to epigenetic reprogramming.FEBS J. 2021 Aug;288(16):4798-4811. doi: 10.1111/febs.15628. Epub 2020 Dec 6. FEBS J. 2021. PMID: 33190371 Review.
-
Reprogramming chromatin.Crit Rev Biochem Mol Biol. 2012 Sep;47(5):464-82. doi: 10.3109/10409238.2012.697125. Epub 2012 Jul 3. Crit Rev Biochem Mol Biol. 2012. PMID: 22757592 Review.
Cited by
-
NR2F1 controls tumour cell dormancy via SOX9- and RARβ-driven quiescence programmes.Nat Commun. 2015 Jan 30;6:6170. doi: 10.1038/ncomms7170. Nat Commun. 2015. PMID: 25636082 Free PMC article.
-
Histone methyltransferase DOT1L drives recovery of gene expression after a genotoxic attack.PLoS Genet. 2013;9(7):e1003611. doi: 10.1371/journal.pgen.1003611. Epub 2013 Jul 4. PLoS Genet. 2013. PMID: 23861670 Free PMC article.
-
A medicinal chemistry perspective for targeting histone H3 lysine-79 methyltransferase DOT1L.J Med Chem. 2013 Nov 27;56(22):8972-83. doi: 10.1021/jm4007752. Epub 2013 Aug 14. J Med Chem. 2013. PMID: 23879463 Free PMC article. Review.
-
Understanding impediments to cellular conversion to pluripotency by assessing the earliest events in ectopic transcription factor binding to the genome.Cell Cycle. 2013 May 15;12(10):1487-91. doi: 10.4161/cc.24663. Epub 2013 Apr 19. Cell Cycle. 2013. PMID: 23603987 Free PMC article.
-
A Multistate Toggle Switch Defines Fungal Cell Fates and Is Regulated by Synergistic Genetic Cues.PLoS Genet. 2016 Oct 6;12(10):e1006353. doi: 10.1371/journal.pgen.1006353. eCollection 2016 Oct. PLoS Genet. 2016. PMID: 27711197 Free PMC article.
References
Publication types
MeSH terms
Substances
Associated data
- Actions
- Actions
Grants and funding
LinkOut - more resources
Full Text Sources
Other Literature Sources
Molecular Biology Databases
Research Materials
