. 2012 Apr 1;188(7):3019-30.
doi: 10.4049/jimmunol.1102294. Epub 2012 Feb 29.

MicroRNA-deficient NK cells exhibit decreased survival but enhanced function

Affiliations

MicroRNA-deficient NK cells exhibit decreased survival but enhanced function

Ryan P Sullivan et al. J Immunol. .

Abstract

NK cells are innate immune lymphocytes important for early host defense against infectious pathogens and malignant transformation. MicroRNAs (miRNAs) are small RNA molecules that regulate a wide variety of cellular processes, typically by specific complementary targeting of the 3'UTR of mRNAs. The Dicer1 gene encodes a conserved enzyme essential for miRNA processing, and Dicer1 deficiency leads to a global defect in miRNA biogenesis. In this study, we report a mouse model of lymphocyte-restricted Dicer1 disruption to evaluate the role of Dicer1-dependent miRNAs in the development and function of NK cells. As expected, Dicer1-deficient NK cells had decreased total miRNA content. Furthermore, miRNA-deficient NK cells exhibited reduced survival and impaired maturation defined by cell surface phenotypic markers. However, Dicer1-deficient NK cells exhibited enhanced degranulation and IFN-γ production in vitro in response to cytokines, tumor target cells, and activating NK cell receptor ligation. Moreover, a similar phenotype of increased IFN-γ was evident during acute MCMV infection in vivo. miRs-15a/15b/16 were identified as abundant miRNAs in NK cells that directly target the murine IFN-γ 3'UTR, thereby providing a potential mechanism for enhanced IFN-γ production. These data suggest that the function of miRNAs in NK cell biology is complex, with an important role in NK cell development, survival, or homeostasis, while tempering peripheral NK cell activation. Further study of individual miRNAs in an NK cell specific fashion will provide insight into these complex miRNA regulatory effects in NK cell biology.


Conflict of interest statement

Disclosures

The authors have no financial conflicts of interest.

Figures
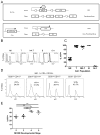
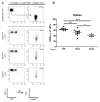
FIGURE 1
FIGURE 1
hCD2-Cre transgenic Cre expression is lymphocyte-specific, present in NK cells at early stages of NK development, and maturing NK cells are YFP positive early in maturation. (A) Schema of Dicer1/Rosa26 excision in the absence (top) or presence (bottom) of the hCD2-Cre transgene. Cre expression is marked by YFP expression from the Rosa26 locus. LoxP sites are indicated with triangles, exons are indicated by boxes. (B) Representative flow histograms and (C) summary data demonstrating the YFP expression of lymphocyte subsets from the spleen in CD2-Cre/RosaYFP mice. Data are the percentage of YFP positivity in each cell type, including NK (NK1.1+CD3), T (CD3+NK1.1), NK-T (NK1.1+CD3+), B (CD19+CD3NK1.1), and myeloid (Gr-1+) cells and represent at least 3 independent experiments. (D) Representative histograms and (E) summary data of the percentage of YFP positivity in NK cell developmental intermediates in the bone marrow as defined by Kim et al. (5) with stage definitions by phenotype listed above each YFP histogram (representative of 2 independent experiments). Significance was calculated using one-way ANOVA. *p<0.05, **p<0.01, ***p<0.001.
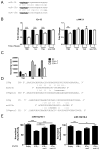
FIGURE 2
FIGURE 2
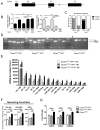
hCD2-Cre transgene expression in NK cells results in Dicer1 excision and loss of mature miRNA expression. (A) Representation of the genomic loxP (triangles)-flanked Dicer1 allele exons (boxes). Primers designed to amplify intact Dicer1 (black) or excised Dicer1 (gray) from cDNA are shown. (B) Real-time RT-qPCR analysis of intact Dicer1 mRNA (left, black bars) or excised Dicer1 mRNA (right, gray bars) in various Dicer1 genotypes of sorted YFP+ NK cells. For qPCR all samples were normalized to 18s rRNA using the ΔΔCT method, and then compared to the level of Dicer1 mRNA in WT NK cells (left) or Dicer1fl/fl YFP+ NK cells (right). Data shown are the mean ± SEM of 2 experiments. (C) Single cell PCR Dicer1 allele frequency. Analysis was supported by at least 12 cells for all cell types except Dicer1fl/fl YFP-NK cells, for which 6 cells were used. (D) Representative gel of Single Cell PCR. Each lane represents a PCR reaction of a single isolated NK cell. Informative product sizes are listed to the right. Dicer1wt = 259bp, Dicer1Δ = 309bp, Dicer1fl = 390bp. Ladder is in increments of 100bp from 100bp to 500bp. * Indicates a failed PCR reaction. Both negative and positive controls provided the expected results (not shown). (E) MiRNA expression in YFP+ Dicer1fl/fl, Dicer1fl/wt, Dicer1wt/wt NK cells measured by Nanostring. Absolute expression profiles of the top 15 miRNAs expressed in Dicer1wt/wt as analyzed by Nanostring showing decreased miRNA expression in Dicer1-deficient NK cells. (F) Summary of miRNA expression changes in Dicer1fl/fl, Dicer1fl/wt, and Dicer1wt/wt YFP+ NK Cells. The geometric mean of Nanostring count groups (>5000, 1000–5000, 100–1000) was compared between Dicer1 genotypes. (G) Confirmation of selected miRNA expression utilizing qRT-PCR of miR-16, miR-21, and miR-30b. Data shown are the mean ± SEM of 3 independent experiments. Significance was calculated using Student’s t-test. *p<0.05, **p<0.01, ***p<0.001.
FIGURE 3
FIGURE 3
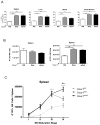
MiRNA-deficient NK cells exhibit an in vivo survival defect. Mononuclear cells were isolated from spleen, liver, blood, and bone marrow. NK cells (CD45+NK1.1+ NKp46+CD3) were analyzed for YFP expression. (A) Percent YFP positive NK cells in indicated tissues for each genotype. (B) Total viable cells were enumerated, the percentage of YFP+/− NK cells was analyzed by flow cytometry, and absolute total NK and YFP+ NK cell numbers were calculated. (C) NK cells were further analyzed for CD27 and CD11b expression, and the absolute number of cells was calculated as above for maturation stages I (CD27CD11b), II (CD27+CD11b), III (CD27+CD11b+), and IV (CD27CD11b+) as described (–29). Significance was calculated using 2-way ANOVA and is presented as Dicer1fl/fl (gray) or Dicer1fl/wt (black) v. Dicer1wt/wt. Data shown are the mean ± SEM of 5 experiments (A–B) or 3 experiments (C). Significance in (A–B) was defined using 1-way ANOVA with a Neuman-Keuls post-test. *p<0.05, **p<0.01, ***p<0.001.
FIGURE 4
FIGURE 4
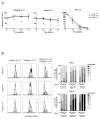
MiRNA-deficient NK cells exhibit defective survival and proliferation in vitro. (A) Splenocytes from CD2-Cre/RosaYFP reporter mice and the indicated Dicer1 genotypes were plated in 24 well plates in K10 medium supplemented with 0, 5, or 100 ng/mL of rmIL-15. The percentage and absolute number of YFP+ NK cells was determined by flow cytometry using counting beads after 2, 24, 48, and 72 hours of culture. Data shown is the mean ± SEM YFP+ NK cell number normalized to the 2-hour time-point from 3 independent experiments. Significance was calculated using 2-way ANOVA and is presented as Dicer1fl/fl (gray) or Dicer1fl/wt (black) v. Dicer1wt/wt. *p<0.05, **p<0.01, ***p<0.001. (B) Splenocytes from CD2-Cre/RosaYFP reporter mice and the indicated Dicer1 genotypes were labeled with CellTrace Violet and plated in K10 medium supplemented with 5 ng/mL (low 15), 100 ng/mL (high IL-15) rmIL-15, or 100 ng/mL rmIL-15 plus 10 ng/mL rmIL-18 (15+18). Cells were harvested after 3 or 5 days and YFP+ NK cells were analyzed for proliferation indicated by dilution of CellTrace Violet dye.
FIGURE 5
FIGURE 5
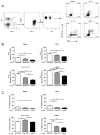
MiRNA-deficient NK cells have increased functional capacity defined by in vitro degranulation and IFN-γ production. Splenocytes were cultured for 7h in K10 medium only, or stimulated with YAC-1 tumor cells, IL-12+IL-15, or anti-NK1.1 (plate bound PK136). (A) Example flow cytometry gating scheme that identifies NK1.1+NKp46+CD3YFP+ NK cells expressing cell surface CD107a or intracellular IFN-γ protein in Dicer1wt/wt splenocytes. Summary data of the percent positive NK cells for CD107a (B) or IFN-γ (C) expression after 7h with the indicated stimulus. The mean ± SEM of 5 independent experiments is shown expressed as the percent maximal expression within each experiment to account for expected inter-assay variability. Significance was calculated using 1-way ANOVA. *p<0.05, **p<0.01, ***p<0.001.
FIGURE 6
FIGURE 6
miRNA-deficient NK cells exhibit enhanced IFN-γ production and degranulation in response to MCMV in vivo. Mice were infected IP with 5x10⁴ PFU of MCMV, and spleens were analyzed for IFN-γ expression by flow cytometry after 36 hours. (A) Representative flow cytometry of YFP expression and IFN-γ staining, previously gated on CD45+NK1.1+NKp46+CD3 lymphocytes. (B) Summary data of IFN-γ staining. Data shown are the mean ± SEM of two independent experiments. Significance was calculated using 1-way ANOVA. *p<0.05, **p<0.01, ***p<0.001.
FIGURE 7
FIGURE 7
The miR-15/16 family is highly expressed in NK cells, decreases upon cytokine activation, and directly represses the murine IFN-γ 3′UTR. (A) Schematic of the relationship of the miR-15/16 family members. (|) indicates a base pair match, whereas (x) indicates base pair differences. Underlined nucleotides indicate the miRNA “seed” sequence. (B) RT-qPCR of sorted WT NK cells activated at baseline (black) or activated for 7 hours (white) in 100ng/mL IL-15 + 10ng/mL IL-12 (left) or with plate-bound PK136 (right). (C) Nanostring miRNA expression analysis comparing the levels of miR-15/16 in sorted NK, CD4+ T, and CD8+ T lymphocytes illustrating that miR-15/16 is abundant in IFN-γ producing cells. (D) Schematic of two separate predicted mir-15/16 binding sites within the IFN-γ 3′UTR, with Watson-Crick (|) and wobble (:) base pairing indicated. In the mutated IFN-γ 3′UTR sequence, “x” indicates bp location altered to disrupt predicted miR-15/16 binding. Nucleotide numbering indicates position from the 5′ end of the IFN-γ 3′ UTR. (E) 293T cells were co-transfected with the psiCheck2 sensor plasmid under the control of the indicated 3′UTR and a pMND vector over-expressing GFP and either miR-15a/16-1 or miR-15b/16-2. Compared to a GFP-only expression vector, or irrelevant miRNA (miR-21, not shown), mmu-miR-15a/16-1 (left) and mmu-miR-15b/16-2 (right) repress translation via direct targeting of the IFN-γ 3′ UTR. This repression is abrogated when both binding sites are mutated, indicating that miR-15/16 repression is specific. Data shown are the mean ± SEM of at least 2 (B,C) or 3 (E) independent experiments. Significance was calculated using 1-way ANOVA. *p<0.05, **p<0.01, ***p<0.001.

Similar articles

Cited by

References

    1. Caligiuri MA. Human natural killer cells. Blood. 2008;112:461–9. - PMC - PubMed
    1. Yokoyama WM, Kim S, French AR. The dynamic life of natural killer cells. Annu Rev Immunol. 2004;22:405–29. - PubMed
    1. Lanier LL. Up on the tightrope: natural killer cell activation and inhibition. Nat Immunol. 2008;9:495–502. - PMC - PubMed
    1. Di Santo JP. Natural killer cells: diversity in search of a niche. Nat Immunol. 2008;9:473–5. - PubMed
    1. Kim S, Iizuka K, Kang HSP, Dokun A, French AR, Greco S, Yokoyama WM. In vivo developmental stages in murine natural killer cell maturation. Nat Immunol. 2002;3:523–8. - PubMed

Publication types

MeSH terms