The IplA Ca2+ channel of Dictyostelium discoideum is necessary for chemotaxis mediated through Ca2+, but not through cAMP, and has a fundamental role in natural aggregation
- PMID: 22375061
- PMCID: PMC3346828
- DOI: 10.1242/jcs.098301
The IplA Ca2+ channel of Dictyostelium discoideum is necessary for chemotaxis mediated through Ca2+, but not through cAMP, and has a fundamental role in natural aggregation
Abstract
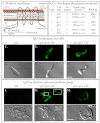
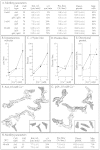
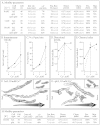
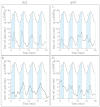
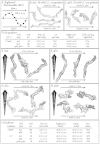
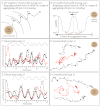
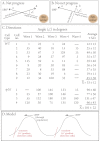
During aggregation of Dictyostelium discoideum, nondissipating, symmetrical, outwardly moving waves of cAMP direct cells towards aggregation centers. It has been assumed that the spatial and temporal characteristics of the front and back of each cAMP wave regulate both chemokinesis and chemotaxis. However, during the period preceding aggregation, cells acquire not only the capacity to chemotax in a spatial gradient of cAMP, but also in a spatial gradient of Ca(2+). The null mutant of the putative IplA Ca(2+) channel gene, iplA(-), undergoes normal chemotaxis in spatial gradients of cAMP and normal chemokinetic responses to increasing temporal gradients of cAMP, both generated in vitro. However, iplA(-) cells lose the capacity to undergo chemotaxis in response to a spatial gradient of Ca(2+), suggesting that IplA is either the Ca(2+) chemotaxis receptor or an essential component of the Ca(2+) chemotaxis regulatory pathway. In response to natural chemotactic waves generated by wild-type cells, the chemokinetic response of iplA(-) cells to the temporal dynamics of the cAMP wave is intact, but the capacity to reorient in the direction of the aggregation center at the onset of each wave is lost. These results suggest that transient Ca(2+) gradients formed between cells at the onset of each natural cAMP wave augment reorientation towards the aggregation center. If this hypothesis proves correct, it will provide a more complex contextual framework for interpreting D. discoideum chemotaxis.
Figures

Similar articles
-
Myosin heavy chain kinases play essential roles in Ca2+, but not cAMP, chemotaxis and the natural aggregation of Dictyostelium discoideum.J Cell Sci. 2012 Oct 15;125(Pt 20):4934-44. doi: 10.1242/jcs.112474. Epub 2012 Aug 16. J Cell Sci. 2012. PMID: 22899719 Free PMC article.
-
Diverse chemotactic responses of Dictyostelium discoideum amoebae in the developing (temporal) and stationary (spatial) concentration gradients of folic acid, cAMP, Ca(2+) and Mg(2+).Cell Motil Cytoskeleton. 2002 Sep;53(1):1-25. doi: 10.1002/cm.10052. Cell Motil Cytoskeleton. 2002. PMID: 12211112
-
Ca2+ regulation in the absence of the iplA gene product in Dictyostelium discoideum.BMC Cell Biol. 2005 Mar 11;6(1):13. doi: 10.1186/1471-2121-6-13. BMC Cell Biol. 2005. PMID: 15760480 Free PMC article.
-
A contextual framework for characterizing motility and chemotaxis mutants in Dictyostelium discoideum.J Muscle Res Cell Motil. 2002;23(7-8):659-72. doi: 10.1023/a:1024459124427. J Muscle Res Cell Motil. 2002. PMID: 12952065 Review.
-
Cell-cell interactions in the development of Dictyostelium.Dev Biol (N Y 1985). 1986;3:261-81. doi: 10.1007/978-1-4684-5050-7_13. Dev Biol (N Y 1985). 1986. PMID: 2855927 Review.
Cited by
-
Calcium responses to external mechanical stimuli in the multicellular stage of Dictyostelium discoideum.Sci Rep. 2022 Jul 20;12(1):12428. doi: 10.1038/s41598-022-16774-3. Sci Rep. 2022. PMID: 35859163 Free PMC article.
-
PTEN redundancy: overexpressing lpten, a homolog of Dictyostelium discoideum ptenA, the ortholog of human PTEN, rescues all behavioral defects of the mutant ptenA-.PLoS One. 2014 Sep 23;9(9):e108495. doi: 10.1371/journal.pone.0108495. eCollection 2014. PLoS One. 2014. PMID: 25247494 Free PMC article.
-
The Dictyostelium Model for Mucolipidosis Type IV.Front Cell Dev Biol. 2022 Apr 13;10:741967. doi: 10.3389/fcell.2022.741967. eCollection 2022. Front Cell Dev Biol. 2022. PMID: 35493081 Free PMC article.
-
Myosin heavy chain kinases play essential roles in Ca2+, but not cAMP, chemotaxis and the natural aggregation of Dictyostelium discoideum.J Cell Sci. 2012 Oct 15;125(Pt 20):4934-44. doi: 10.1242/jcs.112474. Epub 2012 Aug 16. J Cell Sci. 2012. PMID: 22899719 Free PMC article.
-
Chemical and mechanical stimuli act on common signal transduction and cytoskeletal networks.Proc Natl Acad Sci U S A. 2016 Nov 22;113(47):E7500-E7509. doi: 10.1073/pnas.1608767113. Epub 2016 Nov 7. Proc Natl Acad Sci U S A. 2016. PMID: 27821730 Free PMC article.
References
-
- Barrera N. P., Morales B., Villalon M. (2007). ATP and adenosine trigger the interaction of plasma membrane IP3 receptors with protein kinase A in oviductal ciliated cells. Biochem. Biophys. Res. Commun. 364, 815-821 - PubMed
-
- Bezprozvanny I. (2005). The inositol 1,4,5-trisphosphate receptors. Cell Calcium 38, 261-272 - PubMed
-
- Blondel O., Takeda J., Janssen H., Seino S., Bell G. I. (1993). Sequence and functional characterization of a third inositol trisphosphate receptor subtype, IP3R-3, expressed in pancreatic islets, kidney, gastrointestinal tract, and other tissues. J. Biol. Chem. 268, 11356-11363 - PubMed
-
- Boudot C., Saidak Z., Boulanouar A. K., Petit L., Gouilleux F., Massy Z., Brazier M., Mentaverri R., Kamel S. (2010). Implication of the calcium sensing receptor and the Phosphoinositide 3-kinase/Akt pathway in the extracellular calcium-mediated migration of RAW 264.7 osteoclast precursor cells. Bone 46, 1416-1423 - PubMed
-
- Brown E. M., MacLeod R. J. (2001). Extracellular calcium sensing and extracellular calcium signaling. Physiol. Rev. 81, 239-297 - PubMed
Publication types
MeSH terms
Substances
LinkOut - more resources
Full Text Sources
Other Literature Sources
Molecular Biology Databases
Miscellaneous

