. 2013 Jan 24;32(4):514-27.
doi: 10.1038/onc.2012.59. Epub 2012 Feb 27.

The nuclear cofactor RAC3/AIB1/SRC-3 enhances Nrf2 signaling by interacting with transactivation domains

Affiliations

The nuclear cofactor RAC3/AIB1/SRC-3 enhances Nrf2 signaling by interacting with transactivation domains

J-H Kim et al. Oncogene. .

Abstract

Nuclear factor erythroid 2-related factor 2 (Nrf2, NM 006164, 605 AA) is essential for the antioxidant responsive element (ARE)-mediated expression of a group of detoxifying antioxidant genes that detoxify carcinogens and protect against oxidative stress. Several proteins have been identified as Nrf2-interacting molecules. In this study, we found that the overexpression of receptor-associated coactivator 3 (RAC3)/AIB-1/steroid receptor coactivator-3, a nuclear coregulator and oncogene frequently amplified in human breast cancers, induced heme oxygenase-1 (HO-1) through Nrf2 transactivation in HeLa cells. Next, we determined the interaction between RAC3 and Nrf2 proteins using a co-immunoprecipitation assay and fluorescence resonance energy transfer analysis. The results showed that RAC3 bound directly to the Nrf2 protein in the nucleus. Subsequently, we identified the interacting domains of Nrf2 and RAC3 using a glutathione S-transferase pull-down assay. The results showed that both the N-terminal RAC3-pasB and C-terminal RAC3-R3B3 domains were tightly bound to the Neh4 and Neh5 transactivation domains. Furthermore, chromatin immunoprecipitation showed that RAC3 bound tightly to the ARE enhancer region of the HO-1 promoter via Nrf2 binding. These data suggest that Nrf2 activation is modulated and directly controlled through interactions with the RAC3 protein in HeLa cells.


Figures
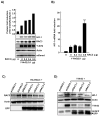
Fig. 1
Fig. 1. HO-1 protein and mRNA were induced by transient transfection with Nrf2 and RAC3 and decreased by siRAC3
A) HeLa cells were transfected with YFP-Nrf2 and HA-RAC3 constructs for 24 h. The construct concentrations are indicated in the materials and methods. The cell lysates (20 μg) were subjected to western blotting to determine HO-1 protein levels. pcDNA3.1 was used to confirm equal transfections. To determine the transfection efficiency, pDsredmono (10 ng) was transfected into each well. The relative fold induction of HO-1 was analyzed using densitometry analysis (upper bar). B) To determine the effect of RAC3 on HO-1 mRNA expression, cDNA from (A) was subjected to qPCR analysis. C) For RAC3 silencing, HeLa cells in 6-well plates were transfected with three different siRAC3 constructs (2 μg; siRAC3-I, -II, and -III) and HA-RAC3 (1 μg) constructs for 24 h. The cells were lysed with RIPA buffer and subjected to western blot analysis. To determine equal plasmid transfection, GFP expression from pRNATin was measured. D) To determine the effects of the siRAC3 constructs on HO-1 expression, HeLa cells were transfected with YFP-Nrf2 (0.8 μg) and three different siRAC3s (0.7 μg) for 24 h. The EGFP protein from the pEGFP empty vector (0.2 μg) was used to confirm equal transfection. GFP expressed by the siRAC3 construct was also used to confirm equal transfection among the siRAC3 constructs. pcDNA3.1 was used to maintain equal transfections for the transfection study. *, p<0.001; **, p<0.02; ***, p<0.0001
Fig. 2
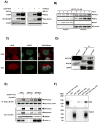
Fig. 2. Nrf2 binds directly to the RAC3 protein
A) Prior to the co-IP study with Nrf2 and RAC3, the two constructs were verified by determining EGFP-Nrf2 and HA-RAC3 expression levels in HeLa cells. The cells were transiently transfected with GFP-Nrf2 (3 μg) or HA-RAC3 (3 μg) using jetPEI reagent (Polyplus-Transfection) for 24 h followed by treatment with MG132, a proteasome inhibitor, for 6 h. The protein samples (20 μg) were subjected to western blot analysis for Nrf2 and RAC3 using anti-GFP or anti-Nrf2 (C-20) and anti-HA or anti-RAC3 (M-397) antibodies. Actin expression was detected to confirm equal loading. B) To determine the subcellular localization of RAC3 and Nrf2 in HeLa cells, MG132 (10 μM) was administered for different times, and the cytosolic and nuclear fractions were isolated using M-PER buffer (Pierce). The fractionated samples (20 μg) were subjected to western blot analysis to measure endogenous protein levels using specific antibodies as indicated. Lamin A was used as the positive control for the nuclear fraction. C) The cellular co-localization of endogenous Nrf2 and RAC3 in HeLa cells was visualized using immunofluorescence microscopy after DL-sulforaphane (SFN, 20 μM) treatment for 16 h. Anti-Nrf2 (Epitomics, California, Burlingame, USA) and an Alexa Fluor 594 secondary antibody was used to visualize Nrf2. Anti-RAC3 (E-11) and an Alexa Fluor 488 secondary antibody was used to visualize RAC3. Magnification, 100X. D) To confirm the binding interaction between Nrf2 and RAC3, whole-cell lysates from MCF7 cells were subjected to the IP of endogenous Nrf2 using an anti-Nrf2 antibody followed by western blotting against endogenous RAC3 using an anti-RAC3 antibody. E) To determine whether Nrf2 could bind to the RAC3 protein, HeLa cells in 6-well plates were transfected with EGFP-Nrf2 (2 μg) and HA-RAC3 (2 μg) constructs for 24 h, and a co-IP assay was performed. A total of 200 μg of protein from the different fractions were immunoprecipitated using anti-RAC3 (M-397) and blotted for EGFP-Nrf2 using an anti-GFP antibody using western blot analysis. The co-IP method is described in the Materials and Methods. GAPDH and Lamin A were used as the controls for the cytosolic and nuclear fractions, respectively. The IgG heavy chain was used to confirm equal bead loading. F) To determine whether Nrf2 could directly bind to RAC3, purified His-Nrf2 and GST-RAC3 expressed in a bacterial expression system were co-incubated, and GST-RAC3 was pulled down using GSH beads in vitro. The protein-bead complexes were subjected to western blot analysis using an anti-Nrf2 (C-20) antibody. The detailed procedures are described in the Materials and Methods. Asterisks indicate the predicted size of the GST-RAC3 protein.
Fig. 3
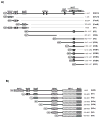
Fig. 3. A schematic diagram showing the different structures of the fragmented domains of His-Nrf2 and GST-RAC3 used in the GST pull-down assay
A) RAC3 and its fragments were subcloned into the bacterial expression vector pGEX2T or pGEX4T to introduce the N-terminal GST-tag. B) Nrf2 and its fragments were subcloned into the bacterial expression vector pET28b(+) to introduce the N-terminal His-tag. The different sizes of the segments are indicated in the figure based on the amino acid (aa) number from the full-length Nrf2 and RAC3. The Nrf2 and RAC3 domains have been previously reported (UniProt Q16236 and Q9Y6Q9).
Fig. 4
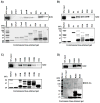
Fig. 4. The RAC3 pasB and R3B3 domains bind to Nrf2
A) The purified GST-RAC3 fragments were incubated with His-Nrf2 protein followed by a GST pull-down assay. The N-terminal fragments (bHLH, pasA, pasB, and R1), the central fragment (R2A), and the C-terminal fragments (R2 and R3) were incubated with His-Nrf2, followed by a GST pull-down assay. The protein-bead complex samples were analyzed using a western blot to detect His-Nrf2 using anti-Nrf2 (C-20). Of the GST-RAC3 segments, pasB and R3 bound strongly to the His-Nrf2 protein. B) To identify the Nrf2-binding domain in the R3 region of RAC3, N-terminal-deleted fragments of R3 (R3A, R3B, and R3C) were incubated with His-Nrf2, followed by a GST pull-down assay. Immunoblotting against His-Nr2 was the same as above. The R3B fragment of GST-RAC3 bound strongly to the His-Nrf2 protein. C) To identify the Nrf2-binding domain in the R3B region of RAC3 based on the previous results in (B), N-terminal-deleted fragments of R3 (R3B2, R3B3, and R3B4) were incubated with His-Nrf2, followed by a GST pull-down assay and western blotting against His-Nr2. The R3B3 segment of GST-RAC3 bound strongly to the His-Nrf2 protein. D) R3B3 and the C-terminal-deleted R3B1 fragment were incubated with His-Nrf2 to verify the binding region of RAC3. The GST pull-down assay was the same as in (A). Equal volumes of purified His-Nrf2 were applied to the reactions, and the same amount of the GST-RAC3 fragments in the reaction was analyzed using an SDS-PAGE gel, which was stained with Coomassie brilliant blue, as shown at the bottom of each experiment. The asterisk indicates the expected size of the proteins. Degraded GST-RAC3 fragments are also shown in Coomassie blue-stained gels.
Fig. 5
Fig. 5. The pasB and R3B3 regions of RAC3 bind strongly to N2 containing the Neh5 domain of Nrf2
To identify the domain of Nrf2 that bound to the pasB and R3B3 regions of RAC3, GST-pasB and GST-R3B3 were incubated with His-Nrf2 and its fragments. The GST pull-down procedures were identical to the previous experiments. An equal amount of purified His-Nrf2 and its fragments were subjected to SDS-PAGE and stained with Coomassie brilliant blue, as shown in the right panel in the figure. In addition, the amount of GST, GST-pasA, and GST-R3B3 segments used in the pull-down assay was subjected to SDS-PAGE and stained with Coomassie brilliant blue, as shown in the bottom of the left panel. An asterisk indicates the expected size of the proteins.
Fig. 6
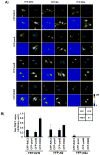
Fig. 6. Fluorescence resonance energy transfer (FRET) signals were strong between the pasB and R3B3 regions in RAC3 and N2 containing the Neh5 domain of Nrf2
To analyze the potential interaction between Nrf2 and RAC3 proteins in HeLa cells, FRET signals were measured using the Zeiss LSM510 laser scanning confocal microscope (Zeiss, Thornwood, New York, USA). The cells plated in glass-bottom dishes were co-transfected with EYFP-Nrf2 or its fragments (EYFP-N2 and EYFP-N2a) and ECFP-RAC3 or its fragments (ECFP-pasB and ECFP-R3B3) in different combinations using jetPEI transfection reagent for 24 h. The procedures for the FRET assay are described in the Materials and Methods. The fluorescent channels are shown in the figure. The intensity of the FRET signal is indicated by a rainbow of colors. The net FRET values were measured using densitometry analysis of the three different FRET signals (bottom).
Fig. 7
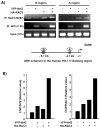
Fig. 7. RAC3 and Nrf2 bind to the ARE enhancers in the 5′-flanking region of the heme oxygenase-1 (HO-1) promoter
A) To determine whether RAC3 could bind to Nrf2/ARE enhancers in HO-1, a ChIP assay was performed. HeLa cells were plated in 100-mm culture dishes and transfected with EYFP-Nrf2 (3.5 μg) and HA-RAC3 (3.5 μg) constructs using the jetPEI reagent for 22 h. The procedures for the ChIP assay are described in the Materials and Methods. The ChIP DNA samples using anti-Nrf2 (C-20) or anti-RAC3 (M-397) were subjected to PCR to amplify the two ARE regions [−4.1 kb (region A) and −9.1 kb (region B)] using specific primers. Non-IP samples were used as input controls. B) ARE region A was also quantified using qPCR.
Fig. 8
Fig. 8
Cartoon showing a possible interaction between Nrf2 and RAC3 in the ARE enhancer region of the HO-1 promoter (upper) through direct interactions between specific domains (lower).

Similar articles

Cited by

References

    1. Alam J, Stewart D, Touchard C, Boinapally S, Choi AM, Cook JL. J Biol Chem. 1999;274:26071–8. - PubMed
    1. Anzick SL, Kononen J, Walker RL, Azorsa DO, Tanner MM, Guan XY, Sauter G, Kallioniemi OP, Trent JM, Meltzer PS. Science. 1997;277:965–8. - PubMed
    1. Arimura A, vn Peer M, Schroder AJ, Rothman PB. J Biol Chem. 2004;279:31105–12. - PubMed
    1. Blank V. J Mol Biol. 2008;376:913–25. - PubMed
    1. Chan K, Han XD, Kan YW. Proc Natl Acad Sci U S A. 2001;98:4611–6. - PMC - PubMed

Publication types

MeSH terms