. 2011:1:153.
doi: 10.1038/srep00153. Epub 2011 Nov 11.

The elementary events underlying force generation in neuronal lamellipodia

Affiliations

The elementary events underlying force generation in neuronal lamellipodia

Ladan Amin et al. Sci Rep. 2011.

Abstract

We have used optical tweezers to identify the elementary events underlying force generation in neuronal lamellipodia. When an optically trapped bead seals on the lamellipodium membrane, Brownian fluctuations decrease revealing the underlying elementary events. The distribution of bead velocities has long tails with frequent large positive and negative values associated to forward and backward jumps occurring in 0.1-0.2 ms with varying amplitudes up to 20 nm. Jump frequency and amplitude are reduced when actin turnover is slowed down by the addition of 25 nM Jasplakinolide. When myosin II is inhibited by the addition of 20 μM Blebbistatin, jump frequency is reduced but to a lesser extent than by Jasplainolide. These jumps constitute the elementary events underlying force generation.


Figures
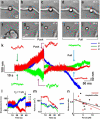
Figure 1
Figure 1. During a push, recordings of the bead position become noisier, but not during a pull.
(a)–(e) The protruding leading edge of a lamellipodium pushes an optically trapped bead by 1 μm within 25 s. (f) A bead trapped in front of a lamellipodium emerging from the soma of a DRG neuron. (g)–(h) High resolution images during a push. At 24 s the bead is in the optical trap (g) and when the lamellipodium grows, it pushes the bead (47 s) displacing it both laterally and axially (h). (i)–(j) As in (g–h) but during a pull. When the lamellipodium retracted, the bead returned inside the trap (56 s). Following bead adhesion, the bead was pulled away from the trap (88 s). Crosses indicate the centre of the optical trap. (k) The three components (x,y,z) of the bead displacement. Insets highlight the increase of noise during the push (violet arrows), the decrease of noise during the pull (cyan arrows), and green arrows refer to Brownian fluctuations. (l) The three components (x,y,z) of bead displacement during adhesion and retraction in another experiment. At 38 s the bead returned into the trap and the adhesion force was measured (11 pN). (m) Change of variance for the three components in (l). (n) Relation between fractional variance reduction and modulus of adhesion force in control conditions (red symbols) and in the presence of 25 nM Jasplakinolide (black symbols). The red and black lines represent the linear fit in control conditions and Jasplakinolide, respectively.
Figure 2
Figure 2. Change of noise in control conditions, in the presence of Blebbistatin and in the presence of Jasplakinolide.
(a) The longitudinal components of the bead displacement during a lateral push in control conditions showing a clear noise increase. (b) As in (a) but in the presence of 25 nM Jasplakinolide. No noise increase is observed. (c) As in (a) but in the presence of 20 μM Blebbistatin. In this case σl2 slightly increased in 4 out of 6 cases. In 2 out of 6 cases σl2 decreased but to a lesser extent in comparison to Jasplakinolide. (d) Relation between force and variance for lateral push in control conditions (red shades), in the presence of 20 μM Blebbistatin (blue shades) and 25 nM Jasplakinolide (black shades).
Figure 3
Figure 3. Concomitant change of variance and contact area during force generation.
(a) Time evolution of estimated contact area Ac (see Ref. 17) between the bead and the lamellipodium leading edge, Ac, during a push. Ac at frame i, Ac(i), is calculated as Ac(i) = 2π [1−cos(αi/2)] r2, where αi is the angle corresponding to the arc of the bead in close contact with the leading edge of the lamellipodium and r is the bead radius, as shown in the inset, representing a lamellipodium pushing the trapped bead. (b) Concomitant time evolution of the force exerted by the lamellipodium during the push analyzed in (a). (c) Concomitant time evolution of the variance during the push analyzed in (a). The broken vertical line indicates the time when the bead is pushed out of the trap.
Figure 4
Figure 4. During pushes the autocorrelation function ρ(t) of bead position decays with multiple time constants and the distribution of bead velocities has long tails.
(a) The z component of the bead displacement during Brownian fluctuations (b.m), adhesion and push. (b) Velocity of bead displacement in (a). (c) Distribution of velocities during Brownian fluctuations shown in (b). A Gaussian function (red line) fits perfectly the experimental distribution. (d) As in (c) during the push shown in (b). (e) Autocorrelation function of vertical bead displacement ρzz(t), during Brownian fluctuations, adhesion, and push after high pass filtering with a cut-off frequency at 1 Hz (see Supplementary Methods and Supplementary Fig. S2 online). ρzz(t) decays with a time constant θ equal to 0.64 ms during b.m. but, during pushing, it has multiple time constants up to 50 ms. (f) The effect of 25 nM Jasplakinolide on ρzz(t), during pushing (black). The longest time constant of the auto-correlation decreases to 20 ms (red trace). (g) Cross-correlation ρzx(t) during b.m. (black shades) and during a push (red shades). ρzx(t) decays with a time constant θ equal to 0.62 ms during b.m. and increases to 6.0 ms during a push. (h) The effect of 25 nM Jasplakinolide on ρzx(t) during pushing. ρzx(t) decays with a time constant θ equal to 0.72 ms during b.m. and increases to 2.47 ms during a push.
Figure 5
Figure 5. Forward and backward jumps are the elementary events underlying force generation.
(a) Magnification of the z component of Fig. 4a during adhesion and push. Original traces in grey were filtered by the non linear diffusion algorithm (see Methods) providing a smooth component (red curves) and jumps (in black). Very few jumps were detected during adhesion but they could be observed very often during a push. (b) Magnification of the z component during adhesion and push in the presence of 20 μM Blebbistatin. The original traces (in gray) were filtered as in (a). Jumps with smaller amplitude than in control conditions were detected. (c) As in (a) and (b) in the presence of 25 nM Jasplakinolide. In this case jumps with an amplitude smaller than the amplitude obtained both in control conditions and in the presence of Blebbistatin were detected. (d)–(f) Density of upward j+ and downward j jumps during push in control conditions (d), in the presence of Blebbistatin (e), and Jasplakinolide (f). These distributions of jump amplitude were fitted (black lines in (d) and (e), red lines in (f)) - for values of j+ and j larger than 2 nm-by the exponential distributions A+ e – (j+/j+*) and A- e – (j−/j−*). The fitting was performed with the values of of 129 and 128 events/s for the jump frequency of positive and negative jumps, A+ and A, respectively, and 5 and 4.8 nm for the mean size of positive and negative jumps, j+* and j*, respectively (d). In the presence of Blebbistatin the values of A+, A, j+* and j* were 87 and 80 events/s and 3.5 and 3.3 nm, respectively (e). In the presence of Jasplakinolide the values of A+, A, j+* and j* were 44 and 50 events/s and 2.5 and 2.3 nm, respectively (f).
Figure 6
Figure 6. Colocalization of jumps and large values of bead velocity.
(a) Bead velocity during a push obtained by the convolution of the bead displacement with the derivative of a Gaussian function (−t/(2*π)1/2 * a2) exp (−t2 /2*a2) with a = 0.1 ms. A jump and a large value of v colocalize if they occur in a time window Δt of less than 0.3 ms. Large values of v were those belonging to the long tails of velocity distribution. These velocities had an absolute value larger than 3 times the standard deviation of the Gaussian fitting the central lobe of the velocity distribution (see Fig. 4d). (b) Jumps detected by nonlinear diffusion in the same portion of the push shown in (a), where velocity was computed. Original trace, gray; smoothed component, red; detected jumps, black. Red and black dotted lines highlight colocalization of positive j+ and negative j jumps, respectively with large values of v. (c) Rate of True Positive colocalization and of False Positive colocalization for increasing values of Δt from 0 to 1 ms, Asterisks represent the classifiers in which positive (red) and negative (black) jumps colocalize exactly with large values of v.
Figure 7
Figure 7. Characterization of force generation during a push in the absence of adhesion.
Episodes of force generation were identified as increases of at least 10 times of the integral Ci(t) of ρii(t), i = x,y,z. (a) The three components (x,y,z) of the bead displacement during a push. (b) Integral Cx(t) (blue), Cy(t)(green), and Cz(t)(red) of the autocorrelation function ρxx(t), ρyy(t), and ρzz(t) of each of the three components of the bead displacements shown in (a). (c) Change in time of the bead displacement variance for the three components in (a). Variance computed in time windows of 0.1 s after high pass filtering at 1 Hz. (d)–(f) Distribution of values of velocity dz/dt (d), dx/dt (e), and dy/dt (f), during force generation shown in (a). The black line represents the Gaussian fit to the distribution. The arrows highlight the tails associated to forward and backward jumps. (g)–(i) Density of upward j+ (red histograms) and downward j (blue histograms) jumps during the push shown in (a) for the z (g), x (h), and y (i) component, respectively.
Figure 8
Figure 8. The sum of forward and backward jumps is equal to the net protrusion.
(a) Bead vertical displacement during a push (red line) in control conditions. The black line represents the sum of all forward jumps (Σ Δt j+) minus the sum of all backward jumps (Σ Δt j) occurring in the time window Δt = 0.5 s, calculated over the whole push. (b) As in (a) in the presence of 25 nM Jasplakinolide.

Similar articles

Cited by

References

    1. Pollard T. D. & Borisy G. G. Cellular motility driven by assembly and disassembly of actin filaments. Cell 112, 453–465 (2003). - PubMed
    1. Bray D., Thomas C. & Shaw G. Growth cone formation in cultures of sensory neurons. Proc. Natl. Acad. Sci. U. S. A 75, 5226–5229 (1978). - PMC - PubMed
    1. Huber A. B., Kolodkin A. L., Ginty D. D. & Cloutier J. F. Signaling at the growth cone: ligand-receptor complexes and the control of axon growth and guidance. Annu. Rev. Neurosci. 26, 509–563 (2003). - PubMed
    1. Landis S. C. Neuronal growth cones. Annu. Rev. Physiol. 45, 567–580 (1983). - PubMed
    1. Pollard T. D., Blanchoin L. & Mullins R. D. Molecular mechanisms controlling actin filament dynamics in nonmuscle cells. Annu. Rev. Biophys. Biomol. Struct. 29, 545–576 (2000). - PubMed

Publication types

MeSH terms