. 2012 Feb 20;196(4):483-96.
doi: 10.1083/jcb.201110114.

Arf6 promotes autophagosome formation via effects on phosphatidylinositol 4,5-bisphosphate and phospholipase D

Affiliations

Arf6 promotes autophagosome formation via effects on phosphatidylinositol 4,5-bisphosphate and phospholipase D

Kevin Moreau et al. J Cell Biol. .

Abstract

Macroautophagy (in this paper referred to as autophagy) and the ubiquitin-proteasome system are the two major catabolic systems in cells. Autophagy involves sequestration of cytosolic contents in double membrane-bounded vesicles called autophagosomes. The membrane source for autophagosomes has received much attention, and diverse sources, such as the plasma membrane, Golgi, endoplasmic reticulum, and mitochondria, have been implicated. These may not be mutually exclusive, but the exact sources and mechanism involved in the formation of autophagosomes are still unclear. In this paper, we identify a positive role for the small G protein Arf6 in autophagosome formation. The effect of Arf6 on autophagy is mediated by its role in the generation of phosphatidylinositol 4,5-bisphosphate (PIP(2)) and in inducing phospholipase D (PLD) activity. PIP(2) and PLD may themselves promote autophagosome biogenesis by influencing endocytic uptake of plasma membrane into autophagosome precursors. However, Arf6 may also influence autophagy by indirect effects, such as either by regulating membrane flow from other compartments or by modulating PLD activity independently of the mammalian target of rapamycin.


Figures
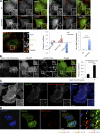
Figure 1.
Figure 1.
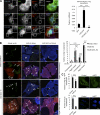
Arf6 colocalizes with early autophagic markers. (A) Colocalization between Arf6-GFP and endogenous Atg12 and Atg16L1. HeLa cells transiently expressing Arf6-GFP for 20 h were cultured in basal conditions (BC) or amino acid and serum starvation medium for 1 h. Cells were fixed and subjected to immunofluorescence with anti-Atg12 or anti-Atg16L1 antibodies. Confocal images of Arf6-GFP and either Atg12 or Atg16L1 are shown. A confocal image of Atg16L1, EEA1, and CTX subunit B conjugated to Alexa Fluor 555 (CTX; 20 min after internalization) is also shown at the bottom left. Please note that Atg16L1 does colocalize with CTX but not with EEA1. Arrows indicate colocalization between EEA1 and cholera toxin (CTX) but not with Atg16L1, whereas arrowheads indicate colocalization between Atg16L1 and CTX but not with EEA1. The Pearson’s coefficient between Arf6 and either Atg12 or Atg16L1 is shown. n = 50 cells. Graph at the bottom right represents the number of Atg12 vesicles per cell under basal or amino acid and serum starvation for 1 h obtained using an automatic microscope. (B) HeLa cells transiently expressing Atg4B C74A–mStrawberry, Arf6-GFP, and Atg16L1-Flag (red) for 20 h were fixed and subjected to immunofluorescence with the anti-Flag antibody. Confocal images of Atg4B C74A–mStrawberry, Arf6-GFP (green), and Atg16L1-Flag (red) are shown. The colocalization (Pearson’s coefficient) between Atg16L1-Flag and Arf6-GFP is shown. n = 20 cells. (C) HeLa cells transiently expressing Atg5-GFP, Arf6-HA, and Atg16L1-mStrawberry for 20 h were fixed and subjected to immunofluorescence with the anti-HA antibody. Confocal images of Atg5-GFP, Arf6-HA, and Atg16L1-mStrawberry are shown. (D) HeLa cells transiently expressing LC3-CFP, Arf6-GFP, and Atg16L1-Flag for 20 h were fixed and subjected to immunofluorescence with the anti-Flag antibody. Confocal images of LC3-CFP, Arf6-GFP, and Atg16L1-Flag are shown. Higher magnifications of the colocalizations are shown in the insets. The data are means ± SD. Bars, 5 µm.
Figure 2.
Figure 2.
Arf6 regulates phagophore formation. (A) HeLa cells transiently expressing LC3-CFP, Atg16L1-Flag, and either GFP, Arf6-GFP, or Arf6 Q67L-GFP for 20 h were fixed and subjected to immunofluorescence with an anti-Flag antibody. Confocal images of LC3-CFP, Atg16L1-Flag, and either GFP, Arf6-GFP, or Arf6 Q67L-GFP are shown. Higher magnifications of the colocalizations are shown in the insets. The colocalization (Pearson’s coefficient) between Atg16L1-Flag vesicles and either GFP, Arf6-GFP, or Arf6 Q67L-GFP is shown. For colocalization, the data are means ± SD. n = 20 cells. (B) HeLa cells transiently expressing Arf6-HA, Arf6 Q67L-HA, or an empty vector and Atg4B C74A–mStrawberry as indicated for 20 h were cultured in basal conditions or amino acid and serum starvation medium for 1 h. Cells were fixed and subjected to immunofluorescence with anti-Atg12 and anti-HA antibodies. Confocal images of Atg12 (green), Arf6, and Atg4B C74A–mStrawberry (red) are shown. The data represent the means ± SD of the number of Atg12 vesicles per cell obtained from three independent experiments in which ≥200 cells were analyzed. Please note that individual channels of the pictures are shown in Fig. S1 B. Arrows indicate Atg12 vesicles, which are larger and brighter than the background-staining speckles. (C) HeLa cells transfected with two rounds of control or Arf6 siRNA for 5 d were fixed and subjected to automatic counting of Atg16L1-GFP or endogenous Atg12 vesicles. Representative confocal pictures are shown. The data represent the means ± SD of the number of Atg16L1-GFP vesicles or Atg12 vesicles per cell obtained from three independent experiments in which ≥200 cells were analyzed. kd, knockdown. Bars, 5 µm.
Figure 3.
Figure 3.
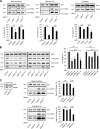
Arf6 regulates autophagosome formation. (A) HeLa cells transfected with two rounds of control or Arf6 siRNA for 5 d were cultured in basal conditions or in starvation medium for 4 h or treated with 100 mM trehalose for the last 20 h and with 400 nM bafilomycin A1 (Baf A1) as indicated for 4 h. Cells were lysed and subjected to Western blotting with the indicated antibodies. The data represent the means ± SD of the percentage of LC3-II/actin ratios obtained from three independent experiments. Black lines indicate that intervening lanes have been spliced out. (B) HeLa cells transfected with two rounds of control or single Arf6 siRNA (n1 to n4) for 5 d were cultured in presence of 400 nM Baf A1 as indicated for 4 h. Cells were lysed and subjected to Western blotting with the indicated antibodies. (C) HeLa cells transfected with two rounds of control or ARNO siRNA for 5 d were cultured in basal conditions or in amino acid and serum starvation medium for 4 h and treated with 400 nM Baf A1 as indicated for 4 h. Cells were lysed and subjected to Western blotting with the indicated antibodies. (B and C) The data represent the means ± SD of the percentage of LC3-II/actin ratios obtained from two independent experiments. SE, short exposure; LE, longer exposure; kd, knockdown.
Figure 4.
Figure 4.
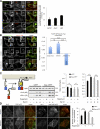
PIP2 regulates autophagosome formation. (A) Colocalization between PLC(PH)-GFP and endogenous Atg5, Atg12, and Atg16L1. HeLa cells transiently expressing PLC(PH)-GFP for 20 h were cultured in starvation medium for 4 h. Cells were fixed and subjected to immunofluorescence with an anti-Atg5, anti-Atg12, or anti-Atg16L1 antibody. Confocal images of PLC(PH)-GFP and either Atg5, Atg12, or Atg16L1 are shown. The colocalization (overlapping) between PLC(PH)-GFP and Atg16L1-, Atg12-, or Atg5-positive vesicles is shown. (B) HeLa cells transiently expressing PLC(PH)-GFP, Atg16L1-Flag, and either Arf6-HA, Arf6 Q67L–HA, or an empty vector for 20 h were fixed and subjected to immunofluorescence with an anti-Flag antibody. Confocal images of PLC(PH)-GFP and Atg16L1-Flag are shown. The colocalization (Pearson’s coefficient) between PLC(PH)-GFP and Atg16L1-Flag is shown. (A and B) For colocalization, the data are means ± SD. n = 20 cells. (C) HeLa cells transiently expressing CFP-FRB and either mRFP-FKBP or mRFP-FKBP-5ase for 20 h were treated as indicated with 2.5 µM rapamycin for 4 h and 400 nM bafilomycin A1 (Baf A1) for 4 h. Cells were lysed and subjected to Western blotting with the indicated antibodies. The data represent the means ± SD of the LC3-II/actin ratios obtained from three independent experiments. SE, short exposure; LE, longer exposure. (D) HeLa cells transiently expressing CFP-FRB and either mRFP-FKBP or mRFP-FKBP-5ase for 20 h were treated as indicated with 2.5 µM rapamycin for 1 h. Cells were fixed and subjected to confocal microscopy and to automatic counting of endogenous Atg12 vesicles. Representative confocal pictures are shown. The data represent the means ± SD of the number of endogenous Atg12 vesicles/cell obtained from three independent experiments. n = 500 cells in each experiment. Higher magnifications of the colocalizations are shown in the insets. Rap, rapamycin. Bars, 5 µm.
Figure 5.
Figure 5.
PIP2 conducts membrane delivery to Atg16L1 precursors. (A) HeLa cells transiently expressing CFP-FRB and either mRFP-FKBP or mRFP-FKBP-5ase for 20 h were treated as indicated with 2.5 µM rapamycin and incubated for 30 min with CTX subunit B conjugated to Alexa Fluor 488 (CTX-488). Cells were fixed and subjected to confocal microscopy. Representative confocal pictures are shown. (B) The data represent the means ± SD of Atg16L1-CTX colocalization (Pearson’s coefficient) from A. n > 30 cells for each condition. Arrows indicate Atg16L1-CTX colocalization, whereas the arrowhead indicates the absence of colocalization between Atg16L1 and CTX. (C) HeLa cells transfected with two rounds of control, Arf6, or PIP5K siRNA for 5 d were transfected during the last 20 h with Atg16L1-GFP. Cells were incubated for 30 min with CTX subunit B conjugated to Alexa Fluor 555 (CTX), fixed, and subjected to confocal microscopy analysis. The data represent the means ± SD of Atg16L1-CTX colocalization (Pearson’s coefficient). n > 30 cells for each condition. Higher magnifications of the colocalizations are shown in the insets. kd, knockdown. Bars, 5 µm.
Figure 6.
Figure 6.
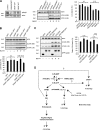
GRAF1 is a positive regulator of autophagy. (A) HeLa cells transfected with two rounds of control, ARHGAP26, GRAF1a, or GRAF1b siRNA for 5 d were treated with 400 nM bafilomycin A1 (Baf A1) as indicated for 4 h. Cells were lysed and subjected to Western blotting with the indicated antibodies. The data represent the means ± SD of the percentage of LC3-II/actin ratios obtained from three independent experiments. Black lines indicate that intervening lanes have been spliced out. (B) HeLa cells transiently expressing either GFP, GRAF1-GFP, or GRAF1 BAR+PH-GFP for 20 h were treated with 400 nM Baf A1 as indicated for 4 h. Cells were lysed and subjected to Western blotting with the indicated antibodies. (C) HeLa cells transiently expressing either GFP, Arf6-GFP, or Arf6 N48R-GFP for 20 h were treated with 400 nM Baf A1 as indicated for 4 h. Cells were lysed and subjected to Western blotting with the indicated antibodies. (B and C) The data represent the means ± SD of the percentage of LC3-II/actin ratios obtained from two independent experiments. (D) Arf6 may regulate autophagy via multiple pathways: Arf6 activates PIP5K, which leads to the production of PIP2 and the regulation of endocytosis; Arf6 activates PLD, which leads to the formation of phosphatidic acid (PA), a lipid involved in autophagosome formation. The question whether Arf6 regulates autophagy via GRAF1, a PIP2-binding protein involved in clathrin-independent endocytosis, remains to be elucidated. Furthermore, Arf6 may regulate autophagy by affecting intracellular membrane flow via additional routes. SE, short exposure; LE, longer exposure.

Similar articles

Cited by

References

    1. Brown F.D., Rozelle A.L., Yin H.L., Balla T., Donaldson J.G. 2001. Phosphatidylinositol 4,5-bisphosphate and Arf6-regulated membrane traffic. J. Cell Biol. 154:1007–1017 10.1083/jcb.200103107 - DOI - PMC - PubMed
    1. Cadwell K., Liu J.Y., Brown S.L., Miyoshi H., Loh J., Lennerz J.K., Kishi C., Kc W., Carrero J.A., Hunt S., et al. 2008. A key role for autophagy and the autophagy gene Atg16l1 in mouse and human intestinal Paneth cells. Nature. 456:259–263 10.1038/nature07416 - DOI - PMC - PubMed
    1. Dall’Armi C., Hurtado-Lorenzo A., Tian H., Morel E., Nezu A., Chan R.B., Yu W.H., Robinson K.S., Yeku O., Small S.A., et al. 2010. The phospholipase D1 pathway modulates macroautophagy. Nat Commun. 1:142 10.1038/ncomms1144 - DOI - PMC - PubMed
    1. Di Paolo G., De Camilli P. 2006. Phosphoinositides in cell regulation and membrane dynamics. Nature. 443:651–657 10.1038/nature05185 - DOI - PubMed
    1. Doherty G.J., McMahon H.T. 2009. Mechanisms of endocytosis. Annu. Rev. Biochem. 78:857–902 10.1146/annurev.biochem.78.081307.110540 - DOI - PubMed

Publication types

MeSH terms

LinkOut - more resources