Tonotopically arranged traveling waves in the miniature hearing organ of bushcrickets
- PMID: 22348035
- PMCID: PMC3278424
- DOI: 10.1371/journal.pone.0031008
Tonotopically arranged traveling waves in the miniature hearing organ of bushcrickets
Abstract
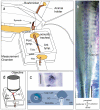
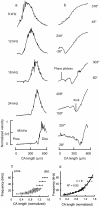
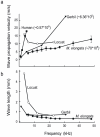
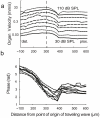
Place based frequency discrimination (tonotopy) is a fundamental property of the coiled mammalian cochlea. Sound vibrations mechanically conducted to the hearing organ manifest themselves into slow moving waves that travel along the length of the organ, also referred to as traveling waves. These traveling waves form the basis of the tonotopic frequency representation in the inner ear of mammals. However, so far, due to the secure housing of the inner ear, these waves only could be measured partially over small accessible regions of the inner ear in a living animal. Here, we demonstrate the existence of tonotopically ordered traveling waves covering most of the length of a miniature hearing organ in the leg of bushcrickets in vivo using laser Doppler vibrometery. The organ is only 1 mm long and its geometry allowed us to investigate almost the entire length with a wide range of stimuli (6 to 60 kHz). The tonotopic location of the traveling wave peak was exponentially related to stimulus frequency. The traveling wave propagated along the hearing organ from the distal (high frequency) to the proximal (low frequency) part of the leg, which is opposite to the propagation direction of incoming sound waves. In addition, we observed a non-linear compression of the velocity response to varying sound pressure levels. The waves are based on the delicate micromechanics of cellular structures different to those of mammals. Hence place based frequency discrimination by traveling waves is a physical phenomenon that presumably evolved in mammals and bushcrickets independently.
Conflict of interest statement
Figures


Similar articles
-
Experimental and Theoretical Explorations of Traveling Waves and Tuning in the Bushcricket Ear.Biophys J. 2019 Jan 8;116(1):165-177. doi: 10.1016/j.bpj.2018.11.3124. Epub 2018 Nov 29. Biophys J. 2019. PMID: 30573177 Free PMC article.
-
Lateralization of travelling wave response in the hearing organ of bushcrickets.PLoS One. 2014 Jan 21;9(1):e86090. doi: 10.1371/journal.pone.0086090. eCollection 2014. PLoS One. 2014. PMID: 24465889 Free PMC article.
-
Morphological basis for a tonotopic design of an insect ear.J Comp Neurol. 2017 Jul 1;525(10):2443-2455. doi: 10.1002/cne.24218. Epub 2017 Apr 18. J Comp Neurol. 2017. PMID: 28369996
-
Travelling waves and tonotopicity in the inner ear: a historical and comparative perspective.J Comp Physiol A Neuroethol Sens Neural Behav Physiol. 2018 Oct;204(9-10):773-781. doi: 10.1007/s00359-018-1279-8. Epub 2018 Aug 16. J Comp Physiol A Neuroethol Sens Neural Behav Physiol. 2018. PMID: 30116889 Review.
-
The physics of hearing: fluid mechanics and the active process of the inner ear.Rep Prog Phys. 2014 Jul;77(7):076601. doi: 10.1088/0034-4885/77/7/076601. Epub 2014 Jul 9. Rep Prog Phys. 2014. PMID: 25006839 Review.
Cited by
-
Discovery of a lipid synthesising organ in the auditory system of an insect.PLoS One. 2012;7(12):e51486. doi: 10.1371/journal.pone.0051486. Epub 2012 Dec 12. PLoS One. 2012. PMID: 23251553 Free PMC article.
-
Position-dependent hearing in three species of bushcrickets (Tettigoniidae, Orthoptera).R Soc Open Sci. 2015 Jun 9;2(6):140473. doi: 10.1098/rsos.140473. eCollection 2015 Jun. R Soc Open Sci. 2015. PMID: 26543574 Free PMC article.
-
Comparative micromechanics of bushcricket ears with and without a specialized auditory fovea region in the crista acustica.Proc Biol Sci. 2020 Jun 24;287(1929):20200909. doi: 10.1098/rspb.2020.0909. Epub 2020 Jun 24. Proc Biol Sci. 2020. PMID: 32576108 Free PMC article.
-
Auditory tuning in the bushcricket miniature hearing organ.Proc Natl Acad Sci U S A. 2021 Oct 26;118(43):e2115779118. doi: 10.1073/pnas.2115779118. Proc Natl Acad Sci U S A. 2021. PMID: 34667126 Free PMC article. No abstract available.
-
Coupled membranes: a mechanism of frequency filtering and transmission in the field cricket ear evidenced by micro-computed tomography, laser Doppler vibrometry and finite element analysis.J R Soc Interface. 2024 Jun;21(215):20230779. doi: 10.1098/rsif.2023.0779. Epub 2024 Jun 21. J R Soc Interface. 2024. PMID: 38903010 Free PMC article.
References
-
- Von Békésy G. Experiments in Hearing. 1960. 745 New York, McGraw-Hill.
-
- Windmill JF, Göpfert MC, Robert D. Tympanal traveling waves in migratory locusts. J Exp Biol. 2005;208:157–168. - PubMed
-
- Sueur J, Windmill JF, Robert D. Tuning the drum: the mechanical basis for frequency discrimination in a Mediterranean cicada. J Exp Biol. 2006;209:4115–4128. - PubMed
-
- Gold T. Hearing. II. The Physical Basis of the Action of the Cochlea. Proceedings of the Royal Society, Series B, Biological Sciences. 1948;135(881):492–498.
Publication types
MeSH terms
LinkOut - more resources
Full Text Sources

