Systematic detection of epistatic interactions based on allele pair frequencies
- PMID: 22346757
- PMCID: PMC3276547
- DOI: 10.1371/journal.pgen.1002463
Systematic detection of epistatic interactions based on allele pair frequencies
Abstract
Epistatic genetic interactions are key for understanding the genetic contribution to complex traits. Epistasis is always defined with respect to some trait such as growth rate or fitness. Whereas most existing epistasis screens explicitly test for a trait, it is also possible to implicitly test for fitness traits by searching for the over- or under-representation of allele pairs in a given population. Such analysis of imbalanced allele pair frequencies of distant loci has not been exploited yet on a genome-wide scale, mostly due to statistical difficulties such as the multiple testing problem. We propose a new approach called Imbalanced Allele Pair frequencies (ImAP) for inferring epistatic interactions that is exclusively based on DNA sequence information. Our approach is based on genome-wide SNP data sampled from a population with known family structure. We make use of genotype information of parent-child trios and inspect 3×3 contingency tables for detecting pairs of alleles from different genomic positions that are over- or under-represented in the population. We also developed a simulation setup which mimics the pedigree structure by simultaneously assuming independence of the markers. When applied to mouse SNP data, our method detected 168 imbalanced allele pairs, which is substantially more than in simulations assuming no interactions. We could validate a significant number of the interactions with external data, and we found that interacting loci are enriched for genes involved in developmental processes.
Conflict of interest statement
The authors have declared that no competing interests exist.
Figures


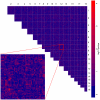
 p-values of each LD block combination on different chromosomes. Light red spots show putatively interacting loci. Inset shows an enlargement of chromosome
  versus chromosome
  .
.
 significant LD block pairs involving
  loci. The barplot on the right shows the average number of interactions per LD block for each chromosome. Chromosomes
  ,
,  , and
, and  show the highest participation in interactions while the fewest interactions per LD block are on chromosome
  .
.
 scale.
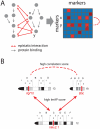
 and
and  sharing a common interacting locus on chromosome
  . The position of the loci on the chromosomes is indicated by red bars. The putatively causal genes are written below the loci. Arrows indicate interactions with ImAP p-values
  , the dashed line indicates a high congruence score (
 ).
).Similar articles
-
Selecting Closely-Linked SNPs Based on Local Epistatic Effects for Haplotype Construction Improves Power of Association Mapping.G3 (Bethesda). 2019 Dec 3;9(12):4115-4126. doi: 10.1534/g3.119.400451. G3 (Bethesda). 2019. PMID: 31604824 Free PMC article.
-
Epistasis detectably alters correlations between genomic sites in a narrow parameter window.PLoS One. 2019 May 31;14(5):e0214036. doi: 10.1371/journal.pone.0214036. eCollection 2019. PLoS One. 2019. PMID: 31150393 Free PMC article.
-
Detecting fitness epistasis in recently admixed populations with genome-wide data.BMC Genomics. 2020 Jul 11;21(1):476. doi: 10.1186/s12864-020-06874-7. BMC Genomics. 2020. PMID: 32652930 Free PMC article.
-
On selecting markers for association studies: patterns of linkage disequilibrium between two and three diallelic loci.Genet Epidemiol. 2003 Jan;24(1):57-67. doi: 10.1002/gepi.10217. Genet Epidemiol. 2003. PMID: 12508256 Review.
-
Analysis of Epistasis in Natural Traits Using Model Organisms.Trends Genet. 2018 Nov;34(11):883-898. doi: 10.1016/j.tig.2018.08.002. Epub 2018 Aug 27. Trends Genet. 2018. PMID: 30166071 Free PMC article. Review.
Cited by
-
The Evolutionary Dynamics of Genetic Incompatibilities Introduced by Duplicated Genes in Arabidopsis thaliana.Mol Biol Evol. 2021 Apr 13;38(4):1225-1240. doi: 10.1093/molbev/msaa306. Mol Biol Evol. 2021. PMID: 33247726 Free PMC article.
-
Systems genetics in "-omics" era: current and future development.Theory Biosci. 2013 Mar;132(1):1-16. doi: 10.1007/s12064-012-0168-x. Epub 2012 Nov 9. Theory Biosci. 2013. PMID: 23138757 Review.
-
GWIS--model-free, fast and exhaustive search for epistatic interactions in case-control GWAS.BMC Genomics. 2013;14 Suppl 3(Suppl 3):S10. doi: 10.1186/1471-2164-14-S3-S10. Epub 2013 May 28. BMC Genomics. 2013. PMID: 23819779 Free PMC article.
-
Cryptic female choice within individual males - A neglected component of the postmating sexual selection?J Evol Biol. 2022 Nov;35(11):1407-1413. doi: 10.1111/jeb.14081. Epub 2022 Aug 21. J Evol Biol. 2022. PMID: 35988118 Free PMC article. Review.
-
Transmission distortion and genetic incompatibilities between alleles in a multigenerational mouse advanced intercross line.Genetics. 2022 Jan 4;220(1):iyab192. doi: 10.1093/genetics/iyab192. Genetics. 2022. PMID: 34791189 Free PMC article.
References
-
- Cordell HJ. Epistasis: what it means, what it doesn't mean, and statistical methods to detect it in humans. Human molecular genetics. 2002;11:2463. - PubMed
-
- Hoh J, Ott J. Mathematical multi-locus approaches to localizing complex human trait genes. Nature Reviews Genetics. 2003;4:701–709. - PubMed
-
- Marchini J, Donnelly P, Cardon LR. Genome-wide strategies for detecting multiple loci that inuence complex diseases. Nature Genetics. 2005;37:413–417. - PubMed
Publication types
MeSH terms
LinkOut - more resources
Full Text Sources

