

A systematic survey of loss-of-function variants in human protein-coding genes
- PMID: 22344438
- PMCID: PMC3299548
- DOI: 10.1126/science.1215040
A systematic survey of loss-of-function variants in human protein-coding genes
Erratum in
- Science. 2012 Apr 20;336(6079):296
Abstract
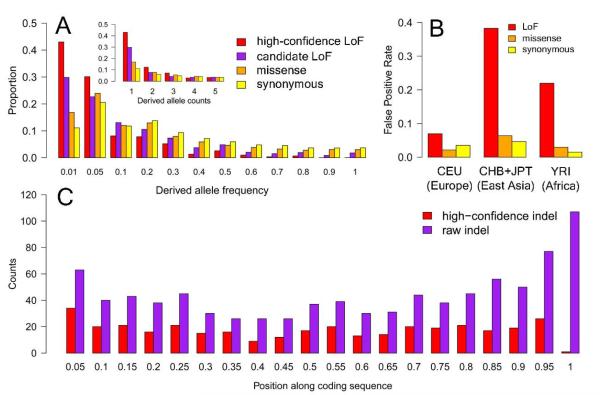
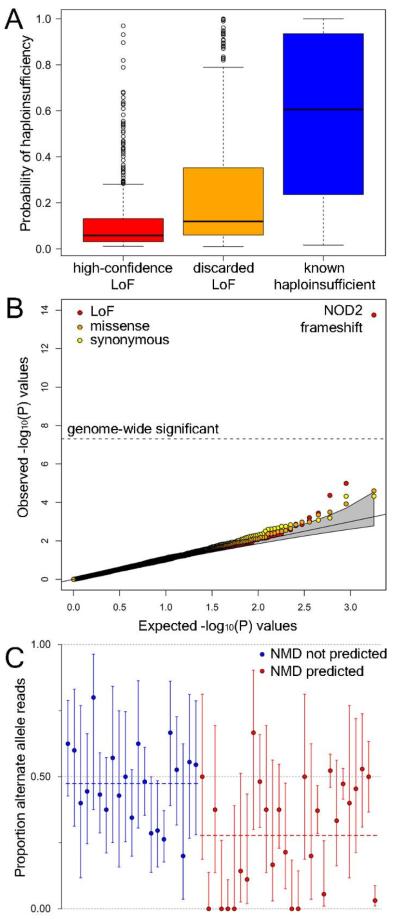
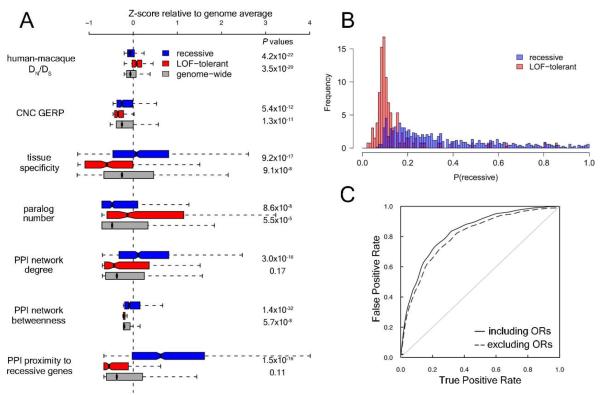
Genome-sequencing studies indicate that all humans carry many genetic variants predicted to cause loss of function (LoF) of protein-coding genes, suggesting unexpected redundancy in the human genome. Here we apply stringent filters to 2951 putative LoF variants obtained from 185 human genomes to determine their true prevalence and properties. We estimate that human genomes typically contain ~100 genuine LoF variants with ~20 genes completely inactivated. We identify rare and likely deleterious LoF alleles, including 26 known and 21 predicted severe disease-causing variants, as well as common LoF variants in nonessential genes. We describe functional and evolutionary differences between LoF-tolerant and recessive disease genes and a method for using these differences to prioritize candidate genes found in clinical sequencing studies.
Figures
Comment in
-
Genetics. Gene losses in the human genome.Science. 2012 Feb 17;335(6070):806-7. doi: 10.1126/science.1219299. Science. 2012. PMID: 22344433 No abstract available.
-
Genomics: How pervasive are defective genes?Nat Rev Genet. 2012 Feb 28;13(4):222. doi: 10.1038/nrg3206. Nat Rev Genet. 2012. PMID: 22371195 No abstract available.
Similar articles
-
Deep sequencing of Danish Holstein dairy cattle for variant detection and insight into potential loss-of-function variants in protein coding genes.BMC Genomics. 2015 Dec 9;16:1043. doi: 10.1186/s12864-015-2249-y. BMC Genomics. 2015. PMID: 26645365 Free PMC article.
-
Loss-of-function variants in the genomes of healthy humans.Hum Mol Genet. 2010 Oct 15;19(R2):R125-30. doi: 10.1093/hmg/ddq365. Epub 2010 Aug 30. Hum Mol Genet. 2010. PMID: 20805107 Free PMC article. Review.
-
Loss-of-function tolerance of enhancers in the human genome.PLoS Genet. 2020 Apr 3;16(4):e1008663. doi: 10.1371/journal.pgen.1008663. eCollection 2020 Apr. PLoS Genet. 2020. PMID: 32243438 Free PMC article.
-
Adaptation and Phenotypic Diversification in Arabidopsis through Loss-of-Function Mutations in Protein-Coding Genes.Plant Cell. 2019 May;31(5):1012-1025. doi: 10.1105/tpc.18.00791. Epub 2019 Mar 18. Plant Cell. 2019. PMID: 30886128 Free PMC article.
-
Needles in stacks of needles: finding disease-causal variants in a wealth of genomic data.Nat Rev Genet. 2011 Aug 18;12(9):628-40. doi: 10.1038/nrg3046. Nat Rev Genet. 2011. PMID: 21850043 Review.
Cited by
-
Deletion of iron regulatory protein 1 causes polycythemia and pulmonary hypertension in mice through translational derepression of HIF2α.Cell Metab. 2013 Feb 5;17(2):271-81. doi: 10.1016/j.cmet.2012.12.016. Cell Metab. 2013. PMID: 23395173 Free PMC article.
-
Natural human knockouts and Mendelian disorders: deep phenotyping in Italian isolates.Eur J Hum Genet. 2021 Aug;29(8):1272-1281. doi: 10.1038/s41431-021-00850-9. Epub 2021 Mar 16. Eur J Hum Genet. 2021. PMID: 33727708 Free PMC article.
-
Allele-specific variation at APOE increases nonalcoholic fatty liver disease and obesity but decreases risk of Alzheimer's disease and myocardial infarction.Hum Mol Genet. 2021 Jul 9;30(15):1443-1456. doi: 10.1093/hmg/ddab096. Hum Mol Genet. 2021. PMID: 33856023 Free PMC article.
-
Rare DNA variants in the brain-derived neurotrophic factor gene increase risk for attention-deficit hyperactivity disorder: a next-generation sequencing study.Mol Psychiatry. 2017 Apr;22(4):580-584. doi: 10.1038/mp.2016.117. Epub 2016 Jul 26. Mol Psychiatry. 2017. PMID: 27457811
-
Heterozygous mis-sense mutations in Prkcb as a critical determinant of anti-polysaccharide antibody formation.Genes Immun. 2013 Jun;14(4):223-33. doi: 10.1038/gene.2013.11. Epub 2013 Apr 4. Genes Immun. 2013. PMID: 23552399 Free PMC article.
References
-
- 1000 Genomes Project Consortium Nature. 2010;467:1061. - PubMed
Publication types
MeSH terms
Substances
Grants and funding
LinkOut - more resources
Full Text Sources
Other Literature Sources
