Abiotic stress responses promote Potato virus A infection in Nicotiana benthamiana
- PMID: 22340188
- PMCID: PMC6638678
- DOI: 10.1111/j.1364-3703.2012.00786.x
Abiotic stress responses promote Potato virus A infection in Nicotiana benthamiana
Abstract
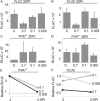
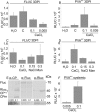
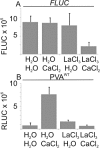
The effect of abiotic stress responses on Potato virus A (PVA; genus Potyvirus) infection was studied. Salt, osmotic and wounding stress all increased PVA gene expression in infected Nicotiana benthamiana leaves. According to the literature, an early response to these stresses is an elevation in cytosolic Ca(2+) concentration. The infiltration of 0.1 m CaCl(2) into the infected leaf area enhanced the translation of PVA RNA, and this Ca(2+) -induced effect was more profound than that induced solely by osmotic stress. The inhibition of voltage-gated Ca(2+) channels within the plasma membrane abolished the Ca(2+) effect, suggesting that Ca(2+) had to be transported into the cytosol to affect viral gene expression. This was also supported by a reduced wounding effect in the presence of the Ca(2+) -chelating agent ethylene glycol tetraacetic acid (EGTA). In the absence of viral replication, the intense synthesis of viral proteins in response to Ca(2+) was transient. However, a Ca(2+) pulse administered at the onset of wild-type PVA infection enhanced the progress of infection within the locally infected leaf, and the virus appeared earlier in the systemic leaves than in the control plants. This suggests that the cellular environment was thoroughly modified by the Ca(2+) pulse to support viral infection. One message of this study is that the sensing of abiotic stress, which leads to cellular responses, probably via Ca(2+) signalling, associated with enhanced virus infection, may lead to higher field crop losses. Therefore, the effect of abiotic stress on plant viral infection warrants further analysis.
© 2012 THE AUTHORS. MOLECULAR PLANT PATHOLOGY © 2012 BSPP AND BLACKWELL PUBLISHING LTD.
Figures


Similar articles
-
Association of host protein VARICOSE with HCPro within a multiprotein complex is crucial for RNA silencing suppression, translation, encapsidation and systemic spread of potato virus A infection.PLoS Pathog. 2020 Oct 12;16(10):e1008956. doi: 10.1371/journal.ppat.1008956. eCollection 2020 Oct. PLoS Pathog. 2020. PMID: 33045020 Free PMC article.
-
P1- and VPg-transgenic plants show similar resistance to Potato virus A and may compromise long distance movement of the virus in plant sections expressing RNA silencing-based resistance.Virus Res. 2006 Mar;116(1-2):208-13. doi: 10.1016/j.virusres.2005.10.015. Epub 2005 Nov 17. Virus Res. 2006. PMID: 16298007
-
Protein composition of 6K2-induced membrane structures formed during Potato virus A infection.Mol Plant Pathol. 2016 Aug;17(6):943-58. doi: 10.1111/mpp.12341. Epub 2016 Feb 17. Mol Plant Pathol. 2016. PMID: 26574906 Free PMC article.
-
Potyvirus-induced gene silencing: the dynamic process of systemic silencing and silencing suppression.J Gen Virol. 2007 Aug;88(Pt 8):2337-2346. doi: 10.1099/vir.0.82928-0. J Gen Virol. 2007. PMID: 17622640
-
The IRE1/bZIP60 Pathway and Bax Inhibitor 1 Suppress Systemic Accumulation of Potyviruses and Potexviruses in Arabidopsis and Nicotiana benthamiana Plants.Mol Plant Microbe Interact. 2016 Oct;29(10):750-766. doi: 10.1094/MPMI-07-16-0147-R. Epub 2016 Oct 24. Mol Plant Microbe Interact. 2016. PMID: 27578623
Cited by
-
Integrated mRNA and microRNA transcriptome analysis reveals miRNA regulation in response to PVA in potato.Sci Rep. 2017 Dec 5;7(1):16925. doi: 10.1038/s41598-017-17059-w. Sci Rep. 2017. PMID: 29208970 Free PMC article.
-
Unveiling the dynamic relationship of viruses and/or symbiotic bacteria with plant resilience in abiotic stress.Stress Biol. 2024 Feb 5;4(1):10. doi: 10.1007/s44154-023-00126-w. Stress Biol. 2024. PMID: 38311681 Free PMC article. Review.
-
Interactions Between Drought and Plant Genotype Change Epidemiological Traits of Cauliflower mosaic virus.Front Plant Sci. 2018 May 24;9:703. doi: 10.3389/fpls.2018.00703. eCollection 2018. Front Plant Sci. 2018. PMID: 29881396 Free PMC article.
-
Water deficit changes the relationships between epidemiological traits of Cauliflower mosaic virus across diverse Arabidopsis thaliana accessions.Sci Rep. 2021 Dec 16;11(1):24103. doi: 10.1038/s41598-021-03462-x. Sci Rep. 2021. PMID: 34916537 Free PMC article.
-
Impact of Abiotic Stresses on Plant Virus Transmission by Aphids.Viruses. 2020 Feb 14;12(2):216. doi: 10.3390/v12020216. Viruses. 2020. PMID: 32075208 Free PMC article. Review.
References
-
- Ahuja, I. , de Vos, R.C.H. , Bones, A.M. and Hall, R.D. (2010) Plant molecular stress responses face climate change. Trends Plant Sci. 15, 664–674. - PubMed
-
- Alfenas‐Zerbini, P. , Maia, I.G. , Fávaro, R.G. , Cascardo, J.C.M. , Brommonschenkel, S.H. and Zerbini, F.M. (2009) Genome‐wide analysis of differentially expressed genes during the early stages of tomato infection by a potyvirus. Mol. Plant–Microbe Interact. 22, 352–361. - PubMed
-
- Anandalakshmi, R. , Marathe, R. , Gel, X. , Herr, J.M. Jr , Mau, C. , Mallory, A. , Pruss, G. , Bowman, L. and Vance, V.B. (2000) A calmodulin‐related protein that suppresses posttranscriptional gene silencing in plants. Science, 290, 142–144. - PubMed
-
- Baebler, S. , Krecic‐Stres, H. , Rotter, A. , Kogovsek, P. , Cankar, K. , Kok, E.J. , Gruden, K. , Kovac, M. , Zel, J. , Pompe‐Novak, M. and Ravnikar, M. (2009) PVYNTN elicits a diverse gene expression response in different potato genotypes in the first 12 h after inoculation. Mol. Plant Pathol. 10, 263–275. - PMC - PubMed
Publication types
MeSH terms
Substances
LinkOut - more resources
Full Text Sources
Miscellaneous

