

Alpharetroviral self-inactivating vectors: long-term transgene expression in murine hematopoietic cells and low genotoxicity
- PMID: 22334016
- PMCID: PMC3345992
- DOI: 10.1038/mt.2011.309
Alpharetroviral self-inactivating vectors: long-term transgene expression in murine hematopoietic cells and low genotoxicity
Abstract
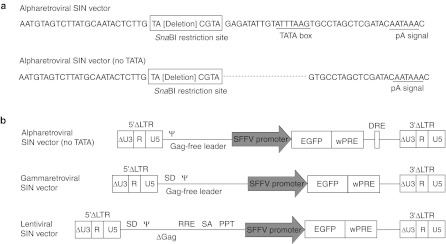
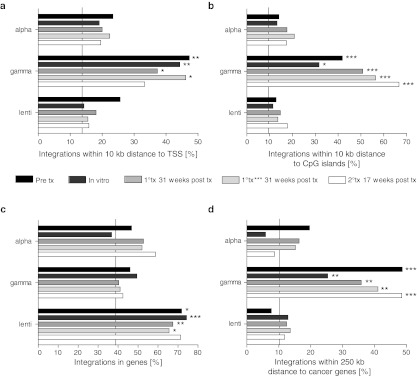
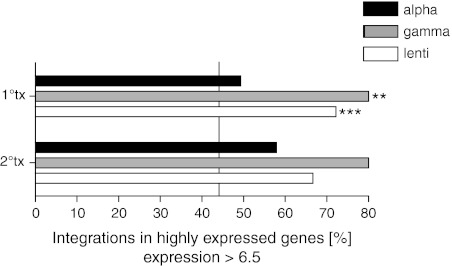
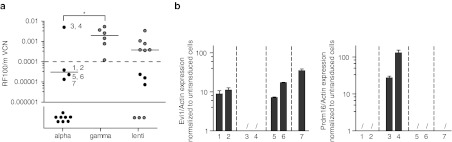
Comparative integrome analyses have highlighted alpharetroviral vectors with a relatively neutral, and thus favorable, integration spectrum. However, previous studies used alpharetroviral vectors harboring viral coding sequences and intact long-terminal repeats (LTRs). We recently developed self-inactivating (SIN) alpharetroviral vectors with an advanced split-packaging design. In a murine bone marrow (BM) transplantation model we now compared alpharetroviral, gammaretroviral, and lentiviral SIN vectors and showed that all vectors transduced hematopoietic stem cells (HSCs), leading to comparable, sustained multilineage transgene expression in primary and secondary transplanted mice. Alpharetroviral integrations were decreased near transcription start sites, CpG islands, and potential cancer genes compared with gammaretroviral, and decreased in genes compared with lentiviral integrations. Analyzing the transcriptome and intragenic integrations in engrafting cells, we observed stronger correlations between in-gene integration targeting and transcriptional activity for gammaretroviral and lentiviral vectors than for alpharetroviral vectors. Importantly, the relatively "extragenic" alpharetroviral integration pattern still supported long-term transgene expression upon serial transplantation. Furthermore, sensitive genotoxicity studies revealed a decreased immortalization incidence compared with gammaretroviral and lentiviral SIN vectors. We conclude that alpharetroviral SIN vectors have a favorable integration pattern which lowers the risk of insertional mutagenesis while supporting long-term transgene expression in the progeny of transplanted HSCs.
Figures

Similar articles
-
Alpharetroviral vector-mediated gene therapy for X-CGD: functional correction and lack of aberrant splicing.Mol Ther. 2013 Mar;21(3):648-61. doi: 10.1038/mt.2012.249. Epub 2012 Dec 4. Mol Ther. 2013. PMID: 23207695 Free PMC article.
-
Self-inactivating alpharetroviral vectors with a split-packaging design.J Virol. 2010 Jul;84(13):6626-35. doi: 10.1128/JVI.00182-10. Epub 2010 Apr 21. J Virol. 2010. PMID: 20410274 Free PMC article.
-
Equal potency of gammaretroviral and lentiviral SIN vectors for expression of O6-methylguanine-DNA methyltransferase in hematopoietic cells.Mol Ther. 2006 Feb;13(2):391-400. doi: 10.1016/j.ymthe.2005.08.012. Epub 2005 Oct 12. Mol Ther. 2006. PMID: 16226060
-
Historical Perspective on the Current Renaissance for Hematopoietic Stem Cell Gene Therapy.Hematol Oncol Clin North Am. 2017 Oct;31(5):721-735. doi: 10.1016/j.hoc.2017.06.006. Hematol Oncol Clin North Am. 2017. PMID: 28895843 Review.
-
Integrating Vectors for Gene Therapy and Clonal Tracking of Engineered Hematopoiesis.Hematol Oncol Clin North Am. 2017 Oct;31(5):737-752. doi: 10.1016/j.hoc.2017.06.009. Hematol Oncol Clin North Am. 2017. PMID: 28895844 Review.
Cited by
-
Alpharetroviral vector-mediated gene therapy for X-CGD: functional correction and lack of aberrant splicing.Mol Ther. 2013 Mar;21(3):648-61. doi: 10.1038/mt.2012.249. Epub 2012 Dec 4. Mol Ther. 2013. PMID: 23207695 Free PMC article.
-
Alpharetroviral vectors: from a cancer-causing agent to a useful tool for human gene therapy.Viruses. 2014 Dec 5;6(12):4811-38. doi: 10.3390/v6124811. Viruses. 2014. PMID: 25490763 Free PMC article. Review.
-
Cancer gene discovery: exploiting insertional mutagenesis.Mol Cancer Res. 2013 Oct;11(10):1141-58. doi: 10.1158/1541-7786.MCR-13-0244. Epub 2013 Aug 8. Mol Cancer Res. 2013. PMID: 23928056 Free PMC article. Review.
-
Development of Automated Separation, Expansion, and Quality Control Protocols for Clinical-Scale Manufacturing of Primary Human NK Cells and Alpharetroviral Chimeric Antigen Receptor Engineering.Hum Gene Ther Methods. 2019 Jun;30(3):102-120. doi: 10.1089/hgtb.2019.039. Epub 2019 May 16. Hum Gene Ther Methods. 2019. PMID: 30997855 Free PMC article.
-
An assessment of the effects of ectopic gp91phox expression in XCGD iPSC-derived neutrophils.Mol Ther Methods Clin Dev. 2015 Dec 9;2:15046. doi: 10.1038/mtm.2015.46. eCollection 2015. Mol Ther Methods Clin Dev. 2015. PMID: 26682238 Free PMC article.
References
-
- Wu X, Li Y, Crise B., and, Burgess SM. Transcription start regions in the human genome are favored targets for MLV integration. Science. 2003;300:1749–1751. - PubMed
-
- Schröder AR, Shinn P, Chen H, Berry C, Ecker JR., and, Bushman F. HIV-1 integration in the human genome favors active genes and local hotspots. Cell. 2002;110:521–529. - PubMed
Publication types
MeSH terms
LinkOut - more resources
Full Text Sources
Other Literature Sources
Medical
Molecular Biology Databases
