Regenerative capacity of adult cortical thymic epithelial cells
- PMID: 22331880
- PMCID: PMC3295321
- DOI: 10.1073/pnas.1118823109
Regenerative capacity of adult cortical thymic epithelial cells
Abstract
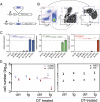
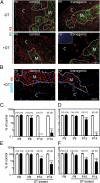
Involution of the thymus is accompanied by a decline in the number of thymic epithelial cells (TECs) and a severely restricted peripheral repertoire of T-cell specificities. TECs are essential for T-cell differentiation; they originate from a bipotent progenitor that gives rise to cells of cortical (cTEC) and medullary (mTEC) phenotypes, via compartment-specific progenitors. Upon acute selective near-total ablation during embryogenesis, regeneration of TECs fails, suggesting that losses from the pool of TEC progenitors are not compensated. However, it is unclear whether this is also true for the compartment-specific progenitors. The decline of cTECs is a prominent feature of thymic involution. Because cTECs support early stages of T-cell development and hence determine the overall lymphopoietic capacity of the thymus, it is possible that the lack of sustained regenerative capacity of cTEC progenitor cells underlies the process of thymic involution. Here, we examine this hypothesis by cell-type-specific conditional ablation of cTECs. Expression of the human diphtheria toxin receptor (hDTR) gene under the regulatory influence of the chemokine receptor Ccx-ckr1 gene renders cTECs sensitive to the cytotoxic effects of diphtheria toxin (DT). As expected, DT treatment of preadolescent and adult mice led to a dramatic loss of cTECs, accompanied by a rapid demise of immature thymocytes. Unexpectedly, however, the cTEC compartment regenerated after cessation of treatment, accompanied by the restoration of T-cell development. These findings provide the basis for the development of targeted interventions unlocking the latent regenerative potential of cTECs to counter thymic involution.
Conflict of interest statement
The authors declare no conflict of interest.
Figures


Similar articles
-
Generation of both cortical and Aire(+) medullary thymic epithelial compartments from CD205(+) progenitors.Eur J Immunol. 2013 Mar;43(3):589-94. doi: 10.1002/eji.201243209. Epub 2013 Feb 11. Eur J Immunol. 2013. PMID: 23299414 Free PMC article.
-
Thymic crosstalk restrains the pool of cortical thymic epithelial cells with progenitor properties.Eur J Immunol. 2017 Jun;47(6):958-969. doi: 10.1002/eji.201746922. Epub 2017 Apr 13. Eur J Immunol. 2017. PMID: 28318017
-
Checkpoints in the development of thymic cortical epithelial cells.J Immunol. 2009 Jan 1;182(1):130-7. doi: 10.4049/jimmunol.182.1.130. J Immunol. 2009. PMID: 19109143
-
Molecular regulatory networks of thymic epithelial cell differentiation.Differentiation. 2019 May-Jun;107:42-49. doi: 10.1016/j.diff.2019.06.002. Epub 2019 Jun 14. Differentiation. 2019. PMID: 31238242 Review.
-
Adult thymic epithelial cell (TEC) progenitors and TEC stem cells: Models and mechanisms for TEC development and maintenance.Eur J Immunol. 2015 Nov;45(11):2985-93. doi: 10.1002/eji.201545844. Epub 2015 Sep 30. Eur J Immunol. 2015. PMID: 26362014 Review.
Cited by
-
Generation and repair of thymic epithelial cells.J Exp Med. 2024 Oct 7;221(10):e20230894. doi: 10.1084/jem.20230894. Epub 2024 Jul 9. J Exp Med. 2024. PMID: 38980292 Free PMC article. Review.
-
Atypical chemokine receptors in the immune system.Nat Rev Immunol. 2024 Oct;24(10):753-769. doi: 10.1038/s41577-024-01025-5. Epub 2024 May 7. Nat Rev Immunol. 2024. PMID: 38714818 Review.
-
Tnpo3 controls splicing of the pre-mRNA encoding the canonical TCR α chain of iNKT cells.Nat Commun. 2023 Jun 20;14(1):3645. doi: 10.1038/s41467-023-39422-4. Nat Commun. 2023. PMID: 37339974 Free PMC article.
-
Revelations in Thymic Epithelial Cell Biology and Heterogeneity from Single-Cell RNA Sequencing and Lineage Tracing Methodologies.Methods Mol Biol. 2023;2580:25-49. doi: 10.1007/978-1-0716-2740-2_2. Methods Mol Biol. 2023. PMID: 36374449 Free PMC article.
-
Human thymoma-associated mutation of the GTF2I transcription factor impairs thymic epithelial progenitor differentiation in mice.Commun Biol. 2022 Sep 29;5(1):1037. doi: 10.1038/s42003-022-04002-7. Commun Biol. 2022. PMID: 36175547 Free PMC article.
References
-
- Min H, Montecino-Rodriguez E, Dorshkind K. Reassessing the role of growth hormone and sex steroids in thymic involution. Clin Immunol. 2006;118:117–123. - PubMed
Publication types
MeSH terms
Substances
LinkOut - more resources
Full Text Sources
Other Literature Sources
Molecular Biology Databases
Research Materials

