Target gene expression levels and competition between transfected and endogenous microRNAs are strong confounding factors in microRNA high-throughput experiments
- PMID: 22325809
- PMCID: PMC3293725
- DOI: 10.1186/1758-907X-3-3
Target gene expression levels and competition between transfected and endogenous microRNAs are strong confounding factors in microRNA high-throughput experiments
Abstract
Background: MicroRNA (miRNA) target genes tend to have relatively long and conserved 3' untranslated regions (UTRs), but to what degree these characteristics contribute to miRNA targeting is poorly understood. Different high-throughput experiments have, for example, shown that miRNAs preferentially regulate genes with both short and long 3' UTRs and that target site conservation is both important and irrelevant for miRNA targeting.
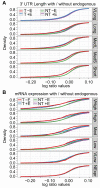
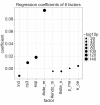
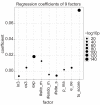
Results: We have analyzed several gene context-dependent features, including 3' UTR length, 3' UTR conservation, and messenger RNA (mRNA) expression levels, reported to have conflicting influence on miRNA regulation. By taking into account confounding factors such as technology-dependent experimental bias and competition between transfected and endogenous miRNAs, we show that two factors - target gene expression and competition - could explain most of the previously reported experimental differences. Moreover, we find that these and other target site-independent features explain about the same amount of variation in target gene expression as the target site-dependent features included in the TargetScan model.
Conclusions: Our results show that it is important to consider confounding factors when interpreting miRNA high throughput experiments and urge special caution when using microarray data to compare average regulatory effects between groups of genes that have different average gene expression levels.
Figures


Similar articles
-
New class of microRNA targets containing simultaneous 5'-UTR and 3'-UTR interaction sites.Genome Res. 2009 Jul;19(7):1175-83. doi: 10.1101/gr.089367.108. Epub 2009 Mar 31. Genome Res. 2009. PMID: 19336450 Free PMC article.
-
The roles of binding site arrangement and combinatorial targeting in microRNA repression of gene expression.Genome Biol. 2007;8(8):R166. doi: 10.1186/gb-2007-8-8-r166. Genome Biol. 2007. PMID: 17697356 Free PMC article.
-
Unified translation repression mechanism for microRNAs and upstream AUGs.BMC Genomics. 2010 Mar 5;11:155. doi: 10.1186/1471-2164-11-155. BMC Genomics. 2010. PMID: 20205738 Free PMC article.
-
Type 2 diabetes mellitus-related genetic polymorphisms in microRNAs and microRNA target sites.J Diabetes. 2014 Jul;6(4):279-89. doi: 10.1111/1753-0407.12143. Epub 2014 Apr 15. J Diabetes. 2014. PMID: 24606011 Review.
-
Oncocers: ceRNA-mediated cross-talk by sponging miRNAs in oncogenic pathways.Tumour Biol. 2015 May;36(5):3129-36. doi: 10.1007/s13277-015-3346-x. Epub 2015 Mar 27. Tumour Biol. 2015. PMID: 25809705 Review.
Cited by
-
MiR-20b Down-Regulates Intestinal Ferroportin Expression In Vitro and In Vivo.Cells. 2019 Sep 24;8(10):1135. doi: 10.3390/cells8101135. Cells. 2019. PMID: 31554201 Free PMC article.
-
Postnatal dynamics of Zeb2 expression in rat brain: analysis of novel 3' UTR sequence reveals a miR-9 interacting site.J Mol Neurosci. 2014 Jan;52(1):138-47. doi: 10.1007/s12031-013-0146-x. Epub 2013 Oct 25. J Mol Neurosci. 2014. PMID: 24458742
-
Integrated analysis of directly captured microRNA targets reveals the impact of microRNAs on mammalian transcriptome.RNA. 2020 Mar;26(3):306-323. doi: 10.1261/rna.073635.119. Epub 2020 Jan 3. RNA. 2020. PMID: 31900330 Free PMC article.
-
A descriptive guide for absolute quantification of produced shRNA pseudotyped lentiviral particles by real-time PCR.J Biol Methods. 2016 Oct 4;3(4):e55. doi: 10.14440/jbm.2016.142. eCollection 2016. J Biol Methods. 2016. PMID: 31453218 Free PMC article.
-
Transcriptome-wide analysis reveals insight into tumor suppressor functions of 1B3, a novel synthetic miR-193a-3p mimic.Mol Ther Nucleic Acids. 2021 Jan 26;23:1161-1171. doi: 10.1016/j.omtn.2021.01.020. eCollection 2021 Mar 5. Mol Ther Nucleic Acids. 2021. PMID: 33664995 Free PMC article.
References
-
- Hwang HW, Mendell JT. MicroRNAs in cell proliferation, cell death, and tumorigenesis. Br J Cancer. 2007;96(Suppl):R40–44. - PubMed
LinkOut - more resources
Full Text Sources
