Quantitative comparison of contrast and imaging depth of ultrahigh-resolution optical coherence tomography images in 800-1700 nm wavelength region
- PMID: 22312581
- PMCID: PMC3269845
- DOI: 10.1364/BOE.3.000282
Quantitative comparison of contrast and imaging depth of ultrahigh-resolution optical coherence tomography images in 800-1700 nm wavelength region
Abstract
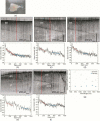
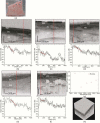
We investigated the wavelength dependence of imaging depth and clearness of structure in ultrahigh-resolution optical coherence tomography over a wide wavelength range. We quantitatively compared the optical properties of samples using supercontinuum sources at five wavelengths, 800 nm, 1060 nm, 1300 nm, 1550 nm, and 1700 nm, with the same system architecture. For samples of industrially used homogeneous materials with low water absorption, the attenuation coefficients of the samples were fitted using Rayleigh scattering theory. We confirmed that the systems with the longer-wavelength sources had lower scattering coefficients and less dependence on the sample materials. For a biomedical sample, we observed wavelength dependence of the attenuation coefficient, which can be explained by absorption by water and hemoglobin.
Keywords: (110.4500) Optical coherence tomography; (170.3880) Medical and biological imaging.
Figures


Similar articles
-
Development of a high power supercontinuum source in the 1.7 μm wavelength region for highly penetrative ultrahigh-resolution optical coherence tomography.Biomed Opt Express. 2014 Feb 26;5(3):932-43. doi: 10.1364/BOE.5.000932. eCollection 2014 Mar 1. Biomed Opt Express. 2014. PMID: 24688825 Free PMC article.
-
Using an oblique incident laser beam to measure the optical properties of stomach mucosa/submucosa tissue.BMC Gastroenterol. 2009 Aug 28;9:64. doi: 10.1186/1471-230X-9-64. BMC Gastroenterol. 2009. PMID: 19715589 Free PMC article.
-
Quantitative In Vivo Imaging of Tissue Absorption, Scattering, and Hemoglobin Concentration in Rat Cortex Using Spatially Modulated Structured Light.In: Frostig RD, editor. In Vivo Optical Imaging of Brain Function. 2nd edition. Boca Raton (FL): CRC Press/Taylor & Francis; 2009. Chapter 12. In: Frostig RD, editor. In Vivo Optical Imaging of Brain Function. 2nd edition. Boca Raton (FL): CRC Press/Taylor & Francis; 2009. Chapter 12. PMID: 26844326 Free Books & Documents. Review.
-
[Optical properties of human normal small intestine tissue with theoretical model of optics about biological tissues at Ar+ laser and 532 nm laser and their linearly polarized laser irradiation in vitro].Guang Pu Xue Yu Guang Pu Fen Xi. 2004 May;24(5):524-8. Guang Pu Xue Yu Guang Pu Fen Xi. 2004. PMID: 15769036 Chinese.
-
Poly(ethylene glycol)-coated gold nanocages bioconjugated with [Nle4,d-Phe7]-α-melanotropin-stimulating hormone.2011 May 29 [updated 2011 Jul 14]. In: Molecular Imaging and Contrast Agent Database (MICAD) [Internet]. Bethesda (MD): National Center for Biotechnology Information (US); 2004–2013. 2011 May 29 [updated 2011 Jul 14]. In: Molecular Imaging and Contrast Agent Database (MICAD) [Internet]. Bethesda (MD): National Center for Biotechnology Information (US); 2004–2013. PMID: 21755635 Free Books & Documents. Review.
Cited by
-
The Development and Clinical Application of Innovative Optical Ophthalmic Imaging Techniques.Front Med (Lausanne). 2022 Jun 30;9:891369. doi: 10.3389/fmed.2022.891369. eCollection 2022. Front Med (Lausanne). 2022. PMID: 35847772 Free PMC article. Review.
-
Four-dimensional live imaging of hemodynamics in mammalian embryonic heart with Doppler optical coherence tomography.J Biophotonics. 2016 Aug;9(8):837-47. doi: 10.1002/jbio.201500314. Epub 2016 Mar 21. J Biophotonics. 2016. PMID: 26996292 Free PMC article.
-
Tuning of successively scanned two monolithic Vernier-tuned lasers and selective data sampling in optical comb swept source optical coherence tomography.Biomed Opt Express. 2013 Nov 22;4(12):2962-87. doi: 10.1364/BOE.4.002962. eCollection 2013. Biomed Opt Express. 2013. PMID: 24409394 Free PMC article.
-
Dispersion mismatch correction for evident chromatic anomaly in low coherence interferometry.APL Photonics. 2024 Jul 1;9(7):076114. doi: 10.1063/5.0207414. Epub 2024 Jul 23. APL Photonics. 2024. PMID: 39072189 Free PMC article.
-
Rapid chemically selective 3D imaging in the mid-infrared.Optica. 2021 Jul 20;8(7):995-1002. doi: 10.1364/OPTICA.426199. Epub 2021 Jul 7. Optica. 2021. PMID: 35233439 Free PMC article.
References
LinkOut - more resources
Full Text Sources
