. 2012 Apr 15;443(2):515-23.
doi: 10.1042/BJ20111871.

Calcium/calmodulin inhibition of the Arabidopsis BRASSINOSTEROID-INSENSITIVE 1 receptor kinase provides a possible link between calcium and brassinosteroid signalling

Affiliations

Calcium/calmodulin inhibition of the Arabidopsis BRASSINOSTEROID-INSENSITIVE 1 receptor kinase provides a possible link between calcium and brassinosteroid signalling

Man-Ho Oh et al. Biochem J. .

Abstract

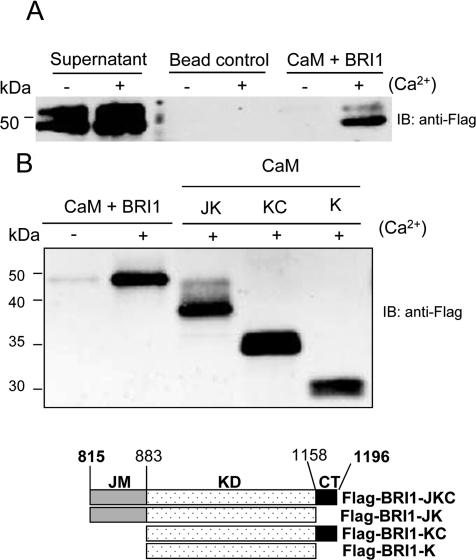
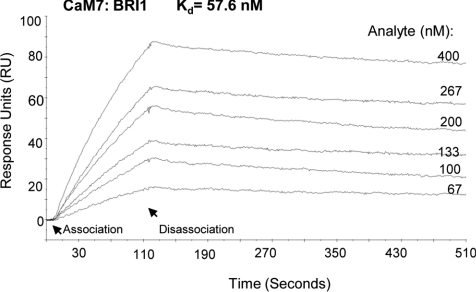
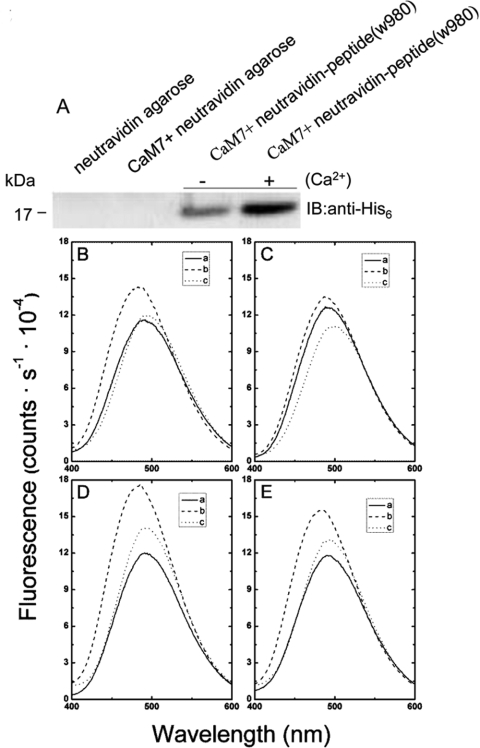
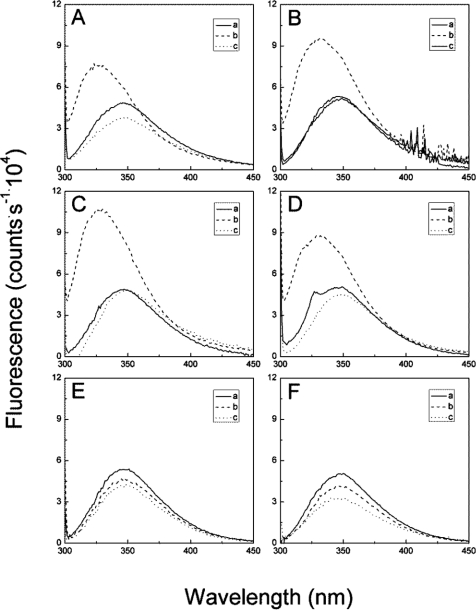
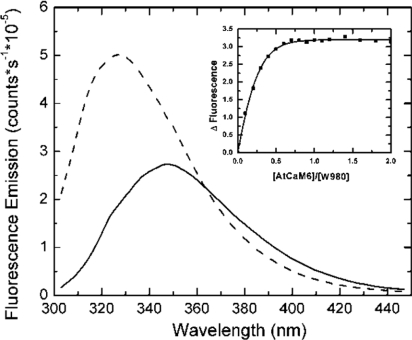
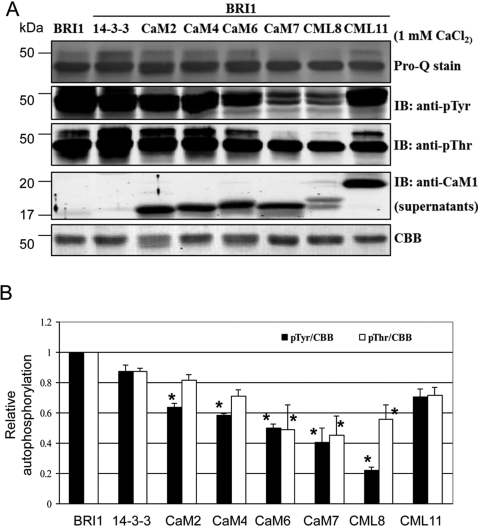
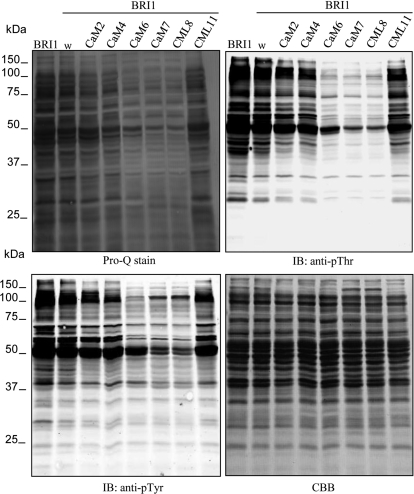
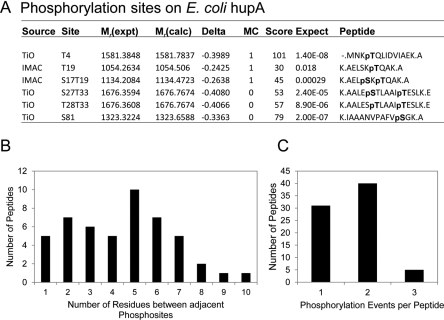
The receptor kinase BRI1 (BRASSINOSTEROID-INSENSITIVE 1) is a key component in BR (brassinosteroid) perception and signal transduction, and has a broad impact on plant growth and development. In the present study, we demonstrate that Arabidopsis CaM (calmodulin) binds to the recombinant cytoplasmic domain of BRI1 in a Ca2+-dependent manner in vitro. In silico analysis predicted binding to Helix E of the BRI1 kinase subdomain VIa and a synthetic peptide based on this sequence interacted with Ca2+/CaM. Co-expression of CaM with the cytoplasmic domain of BRI1 in Escherichia coli strongly reduced autophosphorylation of BRI1, in particular on tyrosine residues, and also reduced the BRI1-mediated transphosphorylation of E. coli proteins on tyrosine, threonine and presumably serine residues. Several isoforms of CaM and CMLs (CaM-like proteins) were more effective (AtCaM6, AtCaM7 and AtCML8, where At is Arabidopsis thaliana) than others (AtCaM2, AtCaM4 and AtCML11) when co-expressed with BRI1 in E. coli. These results establish a novel assay for recombinant BRI1 transphosphorylation activity and collectively uncover a possible new link between Ca2+ and BR signalling.


Figures

Figure 1
Figure 1. Interaction of CaM with BRI1
(A) Binding of FLAG–BRI1 to AtCaM7–Ni-NTA–agarose beads in the presence (+) or absence (−) of Ca2+. The ‘bead control’ refers to FLAG–BRI1 applied to Ni-NTA beads alone, and ‘CaM + BRI1’ refers to FLAG–BRI1 applied to AtCaM7–Ni-NTA–agarose beads. Proteins retained by the beads were eluted with sample buffer and analysed by SDS/PAGE followed by immunoblotting (IB) with anti-FLAG antibodies. (B) Schematic map of the truncated BRI1-CD domains (KD, KDCT, JMKD and CD) and their binding to AtCaM7–Ni-NTA–agarose beads in the presence (+) or absence (−) of Ca2+ as judged by SDS/PAGE and immunoblotting (IB) using anti-FLAG. JM, juxtamembrane region; KD, kinase domain; CT, C-terminal region. Molecular masses are indicated in kDa.
Figure 2
Figure 2. SPR analysis of the CaM–BRI1 interaction
The real-time CaM–BRI1 interaction was analysed by SPR using a Biacore™ 3000 system. The ligand was His6–AtCaM7 protein that was immobilized (~300 RU) and the indicated concentrations of FLAG–BRI1 cytoplasmic domain protein were applied as analyte. The disassociation was monitored for 10 min, but only the first 6 min are shown. Binding curves were normalized with a blank flow cell and a control curve of empty analyte injection, and the Kd value was calculated with the Langmuir model in BIAevaluation 3.0 using data from the six binding curves.
Figure 3
Figure 3. CaM interaction with peptides derived from BRI1 and known CaM-binding proteins
(A) Binding of His6–AtCaM7 to immobilized biotin–W980 peptide bound to neutravidin–agarose beads in the presence (+) or absence (−) of Ca2+. His6–AtCaM7 proteins that bound were subsequently eluted and subjected to SDS/PAGE and immunoblotting (IB) using anti-His6 antibodies. A molecular mass of 17 kDa is indicated. (BE) Dansylated AtCaM2 (500 nM) in 20 mM Hepes/KOH (pH 7.2) and 100 mM KCl was incubated with a 2-fold molar excess of peptides derived from (B) BRI1 W1099, (C) BRI1 W980, (D) CaMKII or (E) CNGC2. Dansylated CaM fluorescence was excited at 335 nm and emission was measured from 400 to 600 nm. In each panel, trace ‘a’ (continuous line) is the spectrum of dansyl-CaM+Ca2+, trace ‘b’ (dashed line) is dansyl-CaM+Ca2++peptide, and trace ‘c’ (dotted line) is the mixture after chelating the Ca2+ with EDTA.
Figure 4
Figure 4. Steady-state tryptophan fluorescence of the BRI1 W980 peptide in the presence of various CaM and CML isoforms
Intrinsic tryptophan fluorescence of the W980 peptide was measured in 20 mM Hepes/KOH (pH 7.2), 100 mM KCl and 1 mM CaCl2 in the presence of (A) AtCaM2 (Z12023), (B) AtCaM4 (Z12022), (C) AtCaM6 (Z12024), (D) AtCaM7 (U82119), (E) AtCML8 (U84678) or (F) AtCML9 (U12490) (GenBank® accession numbers are given within parentheses). In each experiment, emission of 1 μM W980 peptide was measured in the absence of CaM or CML proteins (continuous lines, a) and after sequential addition of 600 nM protein (dashed lines, b) and 5 mM EDTA (dotted lines, c).
Figure 5
Figure 5. Stoichiometry of binding of AtCaM6 to the W980 peptide using steady-state tryptophan fluorescence
Intrinsic tryptophan fluorescence of W980 (2 μM) was measured in 20 mM Hepes/KOH (pH 7.2), 100 mM KCl and 1 mM CaCl2 following sequential additions of CaM6. Only the curves for 0 (continuous line) and 1 (broken line) mol equivalent of CaM6 are shown for clarity. The inset shows the change in fluorescence intensity (ΔFluorescence) at λmax of the CaM6–W980 complex plotted against the [CaM6]/[W980] ratio. The data were fitted by a Boltzmann function to produce a binding curve using Origin (version 8.0).
Figure 6
Figure 6. Inhibition of BRI1 autophosphorylation by co-expression of CaM
(A) Co-expression of individual CaM or CML isoforms with recombinant BRI1 cytoplasmic domain (CD) in E. coli cultured in LB (Luria–Bertani) medium containing 1 mM CaCl2. FLAG–BRI1-CD proteins were separated by SDS/PAGE and analysed for total phosphorylation by Pro-Q staining or for more specific phosphorylation on tyrosine or threonine residues by immunoblotting (IB) using generic antibodies as indicated. Results are representative of four independent experiments. Molecular masses are indicated in kDa. (B) The results obtained from immunoblotting were quantified as the relative autophosphorylation levels on tyrosine (black bars) or threonine (white bars), normalized for Coomassie Brilliant Blue (CBB)-stained protein, and values for the BRI1 control were set at 1. *P≤0.05 relative to the BRI1 control using Student's t test.
Figure 7
Figure 7. Inhibition of BRI1-mediated transphosphorylation of E. coli proteins by co-expression of CaM proteins
Following affinity-purification of FLAG–BRI1 protein from cultures co-expressing CaM or CML isoforms, aliquots (containing 15 μg of predominantly E. coli proteins) of the remaining protein fraction were separated by SDS/PAGE and analysed for phosphorylation as described in Figure 6. w, 14-3-3ω; CBB, Coomassie Brilliant Blue; IB, immunoblotting. Molecular masses are indicated in kDa.
Figure 8
Figure 8. Identification of BRI1-mediated transphosphorylation sites on E. coli proteins
(A) Representative LC–MS/MS results identifying BRI1-mediated phosphorylation sites on the DNA-binding protein hupA, obtained by enrichment of phosphopeptides using TiO2 (TiO) or Fe3+-IMAC (IMAC) as indicated. The complete list of phosphosites identified is presented in Supplementary Table S1 at http://www.BiochemJ.org/bj/443/bj4430515add.htm. Mr(expt), expected molecular mass; Mr(calc), calculated molecular mass; MC, the number of missed cleavages; Score, Mascot score, which is a probability-based implementation of the Mowse algorithm. The total score is the absolute probability that the observed match is a random event and is calculated as −10·log10(P), where P is the absolute probability. Expect, expectation value, which is directly equivalent to the E-value in a BLAST search result. The lower the expectation value, the more significant the score. (B) Number of residues between adjacent phosphosites in multiply phosphorylated peptides. (C) Number of singly, doubly or triply phosphorylated peptides identified.

Similar articles

Cited by

References

    1. Chae L., Sudat S., Dudoit S., Zhu T., Luan S. Diverse transcriptional programs associated with environmental stress and hormones in the Arabidopsis receptor-like kinase gene family. Mol. Plant. 2009;2:84–107. - PMC - PubMed
    1. Lehti-Shiu M. D., Zou C., Hanada K., Shiu S.-H. Evolutionary history and stress regulation of plant receptor-like kinase/Pelle genes. Plant Physiol. 2009;150:12–26. - PMC - PubMed
    1. Nurnberger T., Kemmerling B. Receptor protein kinases: pattern recognition receptors in plant immunity. Trends Plant Sci. 2006;11:519–522. - PubMed
    1. Clouse S. D. Brassinosteroid signal transduction: from receptor kinase activation to transcriptional networks regulating plant development. Plant Cell. 2011;23:1219–1230. - PMC - PubMed
    1. Li J., Chory J. A putative leucine-rich repeat receptor kinase involved in brassinosteroid signal transduction. Cell. 1997;90:929–938. - PubMed

Publication types

MeSH terms