. 2012 Mar;122(3):1082-96.
doi: 10.1172/JCI61029. Epub 2012 Feb 6.

DC-derived IL-18 drives Treg differentiation, murine Helicobacter pylori-specific immune tolerance, and asthma protection

Affiliations

DC-derived IL-18 drives Treg differentiation, murine Helicobacter pylori-specific immune tolerance, and asthma protection

Mathias Oertli et al. J Clin Invest. 2012 Mar.

Abstract

Persistent colonization with the gastric bacterial pathogen Helicobacter pylori causes gastritis and predisposes infected individuals to gastric cancer. Conversely, it is also linked to protection from allergic, chronic inflammatory, and autoimmune diseases. We demonstrate here that H. pylori inhibits LPS-induced maturation of DCs and reprograms DCs toward a tolerance-promoting phenotype. Our results showed that DCs exposed to H. pylori in vitro or in vivo failed to induce T cell effector functions. Instead, they efficiently induced expression of the forkhead transcription factor FoxP3, the master regulator of Tregs, in naive T cells. Depletion of DCs in mice infected with H. pylori during the neonatal period was sufficient to break H. pylori-specific tolerance. DC depletion resulted in improved control of the infection but also aggravated T cell-driven immunopathology. Consistent with the mouse data, DCs infiltrating the gastric mucosa of human H. pylori carriers exhibited a semimature DC-SIGN(+)HLA-DR(hi)CD80(lo)CD86(lo) phenotype. Mechanistically, the tolerogenic activity of H. pylori-experienced DCs was shown to require IL-18 in vitro and in vivo; DC-derived IL-18 acted directly on T cells to drive their conversion to Tregs. CD4(+)CD25(+) Tregs from infected wild-type mice but not Il18(-/-) or Il18r1(-/-) mice prevented airway inflammation and hyperresponsiveness in an experimental model of asthma. Taken together, our results indicate that tolerogenic reprogramming of DCs ensures the persistence of H. pylori and protects against allergic asthma in a process that requires IL-18.


Figures

Figure 1
Figure 1. The TLR ligand-induced maturation of DCs is impaired by H. pylori infection.
(AC) BM-DCs were infected with H. pylori (Hp) strain PMSS1 at a MOI of 50 and/or treated with 0.5 μg/ml E. coli LPS for 16 hours prior to (A and B) the flow cytometric analysis of CD80, CD86, and CD40 expression and (C) the quantification of IL-12p40, IL-6, and IL-10 secretion by ELISA. Representative FACS plots are shown for CD80 in A, and the average MFI of CD80, CD86, and CD40 expression of all CD11c+ cells is shown in B. (D and E) BM-DCs were infected with H. pylori strain PMSS1 or its isogenic mutant, PMSS1ΔCagE (ΔE), and/or treated with LPS for 16 hours and (D) assessed for CD80 expression and (E) IL-12p40 secretion. (F and G) BM-DCs were infected with H. pylori strain PMSS1 and/or treated with LPS for 16 hours and (F) assessed for CD80 expression and (G) IL-12p40 secretion; bacteria were separated from the cells by a transwell (tw) filter where indicated. (H and I) BM-DCs were infected with H. pylori strain PMSS1 and/or treated with 0.5 μg/ml LPS or 5 μg/ml Pam3Cys (Pam) for 16 hours and assessed for (H) CD80 expression and (I) IL-12p40 secretion. Data are representative of (DI) at least 3 and (AC) up to 8 independent experiments and are represented as mean ± SEM of triplicate cultures. P values were calculated using Student’s t test.
Figure 2
Figure 2. H. pylori–experienced DCs induce FoxP3 expression in naive T cells.
(A and B) BM-DCs were infected with H. pylori PMSS1 (MOI 50); after 16 hours, bacteria were killed with antibiotics. DCs were cocultured with immunomagnetically isolated, splenic CD4+CD25 T cells for 3 days in the presence of rTGF-β, rIL-2, and anti-CD3ε mAb prior to flow cytometric analysis of CD4, CD25, and FoxP3 expression. (A) Representative plots of the CD4+ gate, (B) along with mean ± SEM of triplicate cocultures. T cells cultured in the absence of DCs served as controls (ctrls). (C and D) BM-DCs were treated as described in A and B and were additionally loaded with 20 μg/ml ovalbumin prior to coculturing with CD4+CD25 OTII T cells in the presence of rTGF-β and rIL-2. (C) Representative CD25 and FoxP3 plots of the CD4+ gate, (D) along with mean ± SEM of triplicates. (E) BM-DCs and T cells were treated as described in A, except that both populations were separated by a transwell filter where indicated. (F) Wild-type, Myd88–/–, and Tlr2–/– BM-DCs were treated as described in A and B. The mean ± SEM of the CD25+FoxP3+ fraction of the CD4+ gate of triplicate cocultures is shown in E and F. (G and H) Immunomagnetically isolated, MLN-derived CD11c+ DCs were treated and cocultured with T cells as described in A and B. (I and J) MLN-derived CD11c+ DCs were treated and cocultured with OTII T cells as described in C and D. (G and I) Representative FACS plots are shown, (H and J) along with mean ± SEM of triplicate cocultures. Numbers indicate the percentage of FoxP3+CD25+ cells. Data are representative of at least 3 and up to 8 experiments.
Figure 3
Figure 3. H. pylori infection impairs the ability of DCs to activate T cell effector functions.
(AC) BM-DCs were infected as described in Figure 2, A and B, and/or loaded with 20 μg/ml ovalbumin prior to coculturing with immunomagnetically isolated, splenic OTII CD4+CD25 T cells for 3 days in the presence of rIL-2. Anti-CD3ε mAb was added where indicated. (A) IFN-γ–producing CD4+ T cells were quantified by intracellular cytokine staining, and (B) IFN-γ secretion into the supernatant was measured by ELISA. (C) Proliferation of parallel cocultures was determined by [3H] thymidine incorporation. T cells cultured without DCs served as controls (–). (DF) Immunomagnetically isolated, MLN-derived CD11c+ DCs were infected and/or loaded with 20 μg/ml ovalbumin prior to coculturing with CD4+CD25 T cells in the presence of rIL-2 and anti-CD3ε mAb. (D) Representative FACS plots demonstrating intracellular IFN-γ are shown, (E) along with mean ± SEM of triplicate cocultures and (F) IFN-γ secretion into the supernatant as determined by ELISA. Numbers indicate the percentage of IFN-γ+ cells of the CD4+ gate. All data are representative of at least 3 independent experiments.
Figure 4
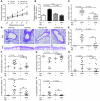
Figure 4. H. pylori–experienced DCs fail to induce asthma-like symptoms in an adoptive transfer model of DC-driven airway hyperresponsiveness.
BM-DCs were infected and treated as described in Figure 2, A and B, and/or loaded with either 20 μg/ml ovalbumin (OVA-DC ± Hp [either infected or not infected with H. pylori]) or PBS only (PBS-DC ± Hp). 1 × 10⁶ BM-DCs per mouse were administered intranasally for the purpose of ovalbumin-specific sensitization; all mice were challenged 2 weeks later with aerosolized ovalbumin and assessed for the development of airway hyperresponsiveness and tissue inflammation. (A and B) Airway hyperresponsiveness, (A) as assessed by challenge with increasing doses of methacholine and (B) the highest dose of 100 mg/ml, respectively. (CE) Tissue inflammation and goblet cell metaplasia, as assessed on H&E- and PAS-stained tissue sections. Representative micrographs are shown in D. Original magnification, ×100 (H&E); ×400 (PAS). Inflammation and PAS scores are shown in C and E. (F) Total cells contained in 1 ml BALF. Percentages of (G) macrophages, (H) lymphocytes, (I) neutrophils, and (J) eosinophils in 1 ml BALF, as determined by differential staining. In the scatter plots shown in C, E, and FJ, each data point represents an individual mouse. Data are representative of 3 independent experiments. Horizontal lines represent the median.
Figure 5
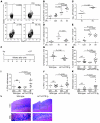
Figure 5. H. pylori–exposed DCs exhibit tolerogenic properties and are required for tolerance in vivo.
(AE) C57BL/6 mice were infected with H. pylori at 7 days (iN) or 6 weeks (iA) of age. Upon sacrifice, CD11c+ MLN-DCs were immunomagnetically isolated; cocultured for 3 days with splenic CD4+CD25 T cells, rTGF-β, rIL-2, and anti-CD3ε mAb; and subjected to flow cytometric analysis of CD4, CD25, and FoxP3 expression. (A) CD25 and FoxP3 staining of the CD4+ gate is shown for representative donors and (B) quantified for all donors. Numbers indicate the percentage of FoxP3+CD25+ cells. (C) H. pylori colonization of mice analyzed in B. (D) CD4+ T cell infiltration into the gastric mucosa of mice shown in B and C. (E) DCs prepared, as described in A, were cultured with CD4+CD25 T cells, rIL-2, and anti-CD3ε mAb and subjected to intracellular IFN-γ staining. Each symbol represents an individual donor, and data are pooled from 2 experiments in BE. (FL) cd11c-DTR tg mice and their wild-type littermates were infected at 1 week of age with H. pylori strain PMSS1 or remained uninfected. (F) All mice received diphtheria toxin during the final 2 weeks of the experiment and were sacrificed 8 weeks after infection. (G) Gastric H. pylori colonization. (H and I) Gastric CD45+ leukocyte and CD4+ T cell infiltration. (J) Intracellular IFN-γ expression by gastric CD4+ T cells. (K and L) Gastric histopathology, as assessed on Giemsa-stained sections. Representative micrographs are shown in L. Original magnification, ×100 (top); ×200 (bottom). Inflammation scores are shown in K. Data in FL are pooled from 3 experiments. Horizontal lines indicate the medians.
Figure 6
Figure 6. Human gastric DCs exhibit a semimature phenotype in infected patients.
(A and B) Antral biopsies were collected from healthy uninfected and H. pylori–infected individuals, and expression of DC-SIGN was determined by immunohistochemical staining. (A) Representative stainings are shown (original magnification, ×100; ×400 [inset]), (B) along with frequencies of DC-SIGN+ DCs, expressed as percentage of stained area in the gastric mucosa. Each symbol indicates an individual donor; horizontal lines represent medians. (C) Gastric DCs in lamina propria single cell preparations from uninfected and H. pylori–infected patients undergoing gastrectomy were identified by flow cytometry as HLA-DRhiDC-SIGN+ cells. Lower dot plots show staining with an isotype control for the DC-SIGN antibody. The percentages indicate cell frequencies among total live (7AAD) cells. (D) Flow cytometric analysis of the immunophenotype of gastric HLA-DRhiDC-SIGN+ DCs. The solid line in histograms shows staining with the indicated antibody, and the dotted line shows staining with isotype controls. Data are shown for 3 uninfected and 3 H. pylori–infected individuals.
Figure 7
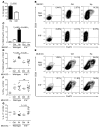
Figure 7. Treg induction by tolerogenic DCs requires IL-18.
(A) Wild-type BM-DCs were infected with H. pylori PMSS1 (MOI 50), and IL-18 secretion was assessed by ELISA. (B and C) Wild-type and Il18–/– BM-DCs were infected as described in A, and cocultured at a 1:2 ratio with immunomagnetically isolated, splenic OTII CD4+CD25 T cells for 3 days in the presence of rTGF-β, rIL-2, and anti-CD3ε mAb prior to the flow cytometric analysis of CD4, CD25, and FoxP3 expression. (B) Representative FACS plots of the CD4+ gate are shown, (C) along with mean ± SEM of triplicate cocultures. (DG) C57BL/6 and BL/6.Il18–/– mice were infected at 7 days (iN) of age with 1 orogastric dose of H. pylori or remained uninfected. Upon sacrifice after 4 weeks after infection, CD11c+ DCs were immunomagnetically isolated from single cell MLN suspensions of individual mice and cocultured for 3 days with splenic CD4+CD25 T cells at a 1:2 ratio in the presence of rIL-2 and anti-CD3ε mAb and (D and E) with or (F and G) without rTGF-β. (D and E) Cocultures were subjected to flow cytometric analysis of CD4, CD25, and FoxP3 expression (representative mice are shown in E, and the quantification of all mice is shown in D) or (F and G) CD4 and IFN-γ or IL-17 expression. Data shown are representative of at least 3 independent (AC) in vitro and (DG) in vivo experiments. Horizontal lines represent the median. (B and E) Numbers indicate the percentage of FoxP3+CD25+ cells.
Figure 8
Figure 8. Treg differentiation and the development of H. pylori–specific tolerance requires IL-18 signaling in vivo.
(A) Single cell MLN preparations from individual C57BL/6, BL/6.Il18–/–, and BL/6.Il18r1–/– mice neonatally infected with H. pylori were subjected to flow cytometric analysis of CD4, CD25, and FoxP3 expression and compared with respective uninfected controls. Each data point represents an individual mouse; horizontal lines indicate medians. (B) Wild-type BM-DCs were infected with H. pylori PMSS1 (MOI 50) and cocultured at a 1:2 ratio with wild-type or Il18r1–/– CD4+CD25 T cells for 3 days in the presence of rTGF-β, rIL-2, and anti-CD3ε mAb prior to analysis of CD4, CD25 and FoxP3 expression. Mean ± SEM of triplicate cocultures are shown. (CF) Wild-type C57BL/6 and BL/6.Il18r1–/– mice were neonatally infected with H. pylori and sacrificed 4 weeks after infection. (C) Gastric H. pylori colonization. (D and E) Gastric mucosal CD45+ leukocyte and CD4+ T cell infiltration. (F) IFN-γ expression by stomach-infiltrating CD4+ T cells, as determined by intracellular cytokine staining. Horizontal lines represent the median.
Figure 9
Figure 9. IL-18 signaling is required for the differentiation of functional Tregs in vivo.
Wild-type C57BL/6 mice were sensitized with 2 i.p. doses of alum-adjuvanted ovalbumin prior to challenge with aerosolized ovalbumin 2 weeks after the last sensitization. Four groups of sensitized recipients received 250,000 immunomagnetically isolated CD4+CD25+ T cells isolated from the pooled MLNs of uninfected or neonatally infected wild-type C57BL/6 or BL/6.Il18–/– donors (4–6 per group) 1 day before the first challenge. Negative controls were challenged without prior sensitization. (A and B) Airway hyperresponsiveness, (A) as assessed by challenge with increasing doses of methacholine and (B) the highest dose of 50 mg/ml, respectively. (CE) Tissue inflammation and goblet cell metaplasia, as assessed on H&E- and PAS-stained tissue sections. Representative micrographs are shown in E. Original magnification, ×100 (H&E); ×400 (PAS). Inflammation and PAS scores are shown in C and D, respectively. (F) Total cells contained in 1 ml BALF. (G) Eosinophils in 1 ml BALF. Horizontal lines indicate medians. s/c, sensitized/challenged.

Comment in

Similar articles

Cited by

References

    1. Maldonado RA, von Andrian UH. How tolerogenic dendritic cells induce regulatory T cells. Adv Immunol. 2010;108:111–165. - PMC - PubMed
    1. Banchereau J, et al. Immunobiology of dendritic cells. Annu Rev Immunol. 2000;18:767–811. doi: 10.1146/annurev.immunol.18.1.767. - DOI - PubMed
    1. Brodsky IE, Monack D. NLR-mediated control of inflammasome assembly in the host response against bacterial pathogens. Semin Immunol. 2009;21(4):199–207. doi: 10.1016/j.smim.2009.05.007. - DOI - PubMed
    1. Ishii KJ, Koyama S, Nakagawa A, Coban C, Akira S. Host innate immune receptors and beyond: making sense of microbial infections. Cell Host Microbe. 2008;3(6):352–363. doi: 10.1016/j.chom.2008.05.003. - DOI - PubMed
    1. Kretschmer K, Apostolou I, Hawiger D, Khazaie K, Nussenzweig MC, von Boehmer H. Inducing and expanding regulatory T cell populations by foreign antigen. Nat Immunol. 2005;6(12):1219–1227. doi: 10.1038/ni1265. - DOI - PubMed

Publication types

MeSH terms