

Metabolically induced heteroplasmy shifting and l-arginine treatment reduce the energetic defect in a neuronal-like model of MELAS
- PMID: 22306605
- PMCID: PMC3339237
- DOI: 10.1016/j.bbadis.2012.01.010
Metabolically induced heteroplasmy shifting and l-arginine treatment reduce the energetic defect in a neuronal-like model of MELAS
Abstract
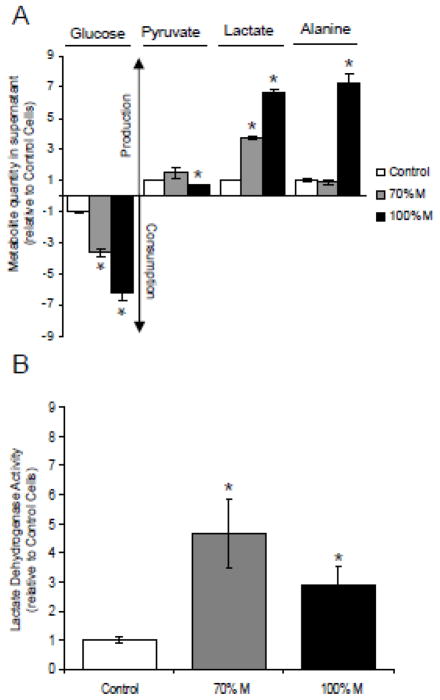
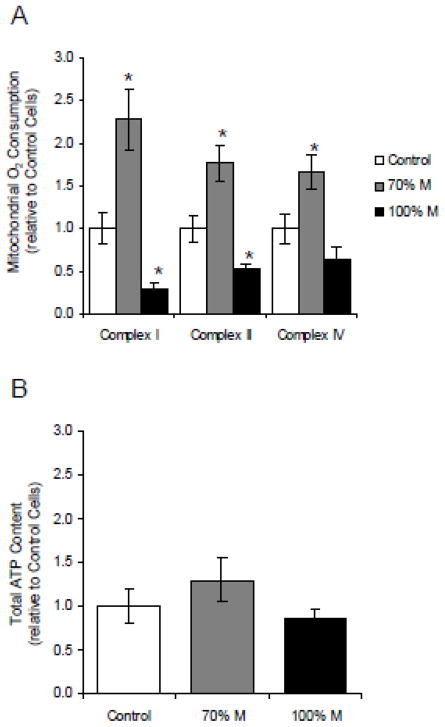
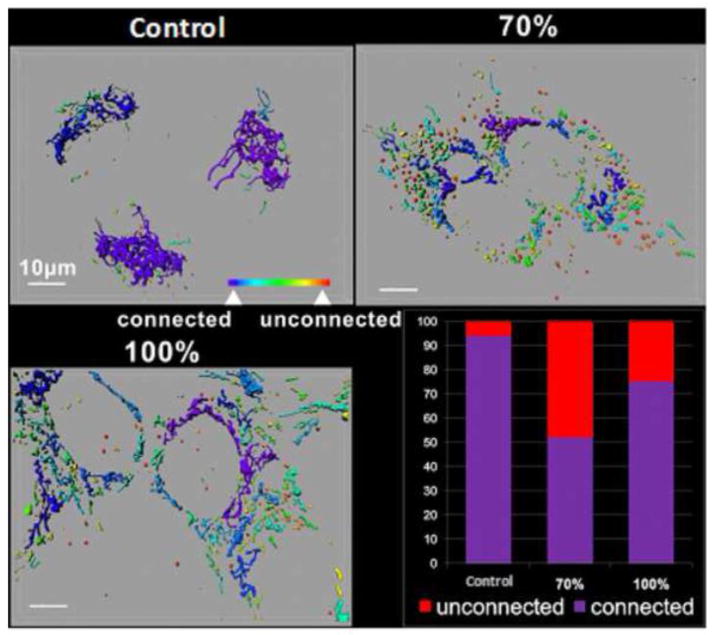
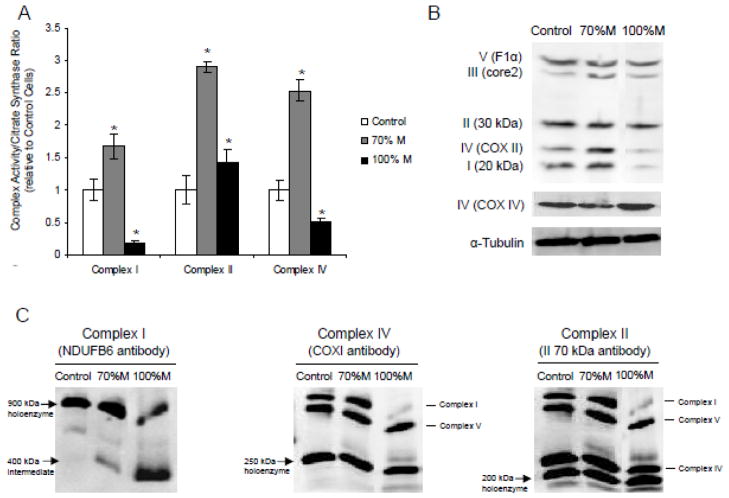
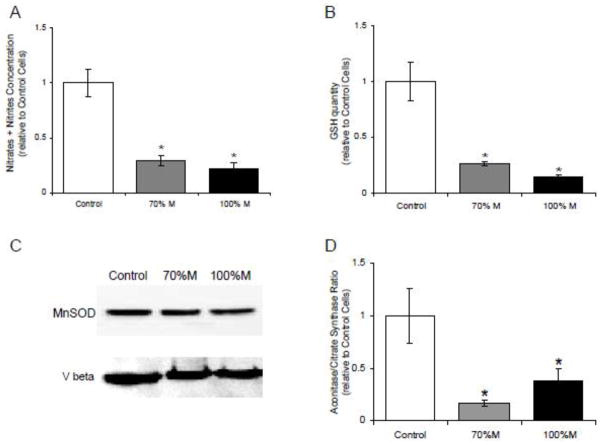
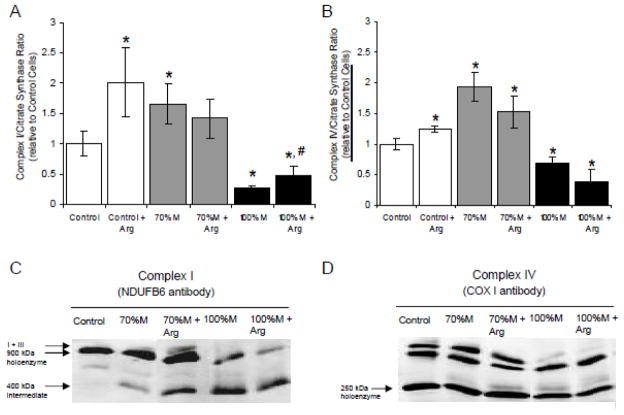
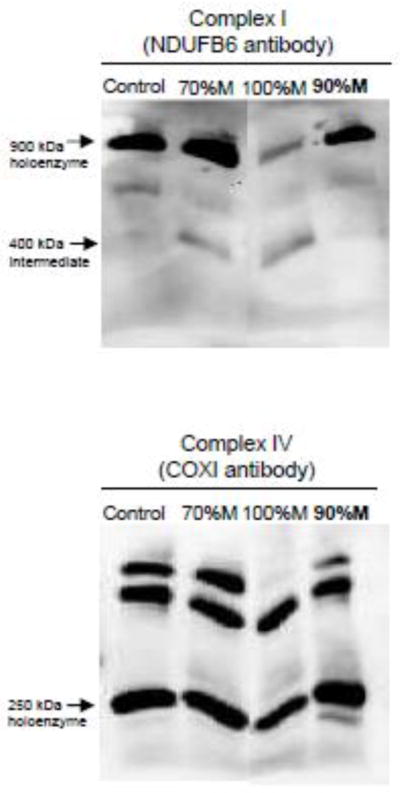
The m.3243A>G variant in the mitochondrial tRNA(Leu(UUR)) gene is a common mitochondrial DNA (mtDNA) mutation. Phenotypic manifestations depend mainly on the heteroplasmy, i.e. the ratio of mutant to normal mtDNA copies. A high percentage of mutant mtDNA is associated with a severe, life-threatening neurological syndrome known as MELAS (mitochondrial myopathy, encephalopathy, lactic acidosis, and stroke-like episodes). MELAS is described as a neurovascular disorder primarily affecting the brain and blood vessels, but the pathophysiology of the disease is poorly understood. We developed a series of cybrid cell lines at two different mutant loads: 70% and 100% in the nuclear background of a neuroblastoma cell line (SH-SY5Y). We investigated the impact of the mutation on the metabolism and mitochondrial respiratory chain activity of the cybrids. The m.3243A>G mitochondrial mutation induced a metabolic switch towards glycolysis in the neuronal cells and produced severe defects in respiratory chain assembly and activity. We used two strategies to compensate for the biochemical defects in the mutant cells: one consisted of lowering the glucose content in the culture medium, and the other involved the addition of l-arginine. The reduction of glucose significantly shifted the 100% mutant cells towards the wild-type, reaching a 90% mutant level and restoring respiratory chain complex assembly. The addition of l-arginine, a nitric oxide (NO) donor, improved complex I activity in the mutant cells in which the defective NO metabolism had led to a relative shortage of NO. Thus, metabolically induced heteroplasmy shifting and l-arginine therapy may constitute promising therapeutic strategies against MELAS.
© 2012 Elsevier B.V. All rights reserved.
Figures
Similar articles
-
The MELAS mutation m.3243A>G promotes reactivation of fetal cardiac genes and an epithelial-mesenchymal transition-like program via dysregulation of miRNAs.Biochim Biophys Acta Mol Basis Dis. 2018 Sep;1864(9 Pt B):3022-3037. doi: 10.1016/j.bbadis.2018.06.014. Epub 2018 Jun 19. Biochim Biophys Acta Mol Basis Dis. 2018. PMID: 29928977
-
The mitochondrial myopathy, encephalopathy, lactic acidosis, and stroke-like episode syndrome-associated human mitochondrial tRNALeu(UUR) mutation causes aminoacylation deficiency and concomitant reduced association of mRNA with ribosomes.J Biol Chem. 2000 Jun 23;275(25):19198-209. doi: 10.1074/jbc.M908734199. J Biol Chem. 2000. PMID: 10858457
-
The addition of ketone bodies alleviates mitochondrial dysfunction by restoring complex I assembly in a MELAS cellular model.Biochim Biophys Acta Mol Basis Dis. 2017 Jan;1863(1):284-291. doi: 10.1016/j.bbadis.2016.10.028. Epub 2016 Nov 1. Biochim Biophys Acta Mol Basis Dis. 2017. PMID: 27815040
-
MELAS syndrome: Clinical manifestations, pathogenesis, and treatment options.Mol Genet Metab. 2015 Sep-Oct;116(1-2):4-12. doi: 10.1016/j.ymgme.2015.06.004. Epub 2015 Jun 15. Mol Genet Metab. 2015. PMID: 26095523 Review.
-
Molecular pathology of MELAS and L-arginine effects.Biochim Biophys Acta. 2012 May;1820(5):608-14. doi: 10.1016/j.bbagen.2011.09.005. Epub 2011 Sep 14. Biochim Biophys Acta. 2012. PMID: 21944974 Review.
Cited by
-
Impaired nitric oxide production in children with MELAS syndrome and the effect of arginine and citrulline supplementation.Mol Genet Metab. 2016 Apr;117(4):407-12. doi: 10.1016/j.ymgme.2016.01.010. Epub 2016 Jan 27. Mol Genet Metab. 2016. PMID: 26851065 Free PMC article.
-
Glutamate-Induced Deregulation of Krebs Cycle in Mitochondrial Encephalopathy Lactic Acidosis Syndrome Stroke-Like Episodes (MELAS) Syndrome Is Alleviated by Ketone Body Exposure.Biomedicines. 2022 Jul 11;10(7):1665. doi: 10.3390/biomedicines10071665. Biomedicines. 2022. PMID: 35884972 Free PMC article.
-
Impact of Mitochondrial A3243G Heteroplasmy on Mitochondrial Bioenergetics and Dynamics of Directly Reprogrammed MELAS Neurons.Cells. 2022 Dec 21;12(1):15. doi: 10.3390/cells12010015. Cells. 2022. PMID: 36611807 Free PMC article.
-
NO control of mitochondrial function in normal and transformed cells.Biochim Biophys Acta Bioenerg. 2017 Aug;1858(8):573-581. doi: 10.1016/j.bbabio.2017.02.009. Epub 2017 Feb 16. Biochim Biophys Acta Bioenerg. 2017. PMID: 28216426 Free PMC article. Review.
-
Single-cell analysis reveals context-dependent, cell-level selection of mtDNA.Nature. 2024 May;629(8011):458-466. doi: 10.1038/s41586-024-07332-0. Epub 2024 Apr 24. Nature. 2024. PMID: 38658765 Free PMC article.
References
-
- Goto Y, Nonaka I, Horai S. A mutation in the tRNA(Leu)(UUR) gene associated with the MELAS subgroup of mitochondrial encephalomyopathies. Nature. 1990;348:651–653. - PubMed
-
- Uusimaa J, Moilanen JS, Vainionpaa L, Tapanainen P, Lindholm P, Nuutinen M, Lopponen T, Maki-Torkko E, Rantala H, Majamaa K. Prevalence, segregation, and phenotype of the mitochondrial DNA 3243A>G mutation in children. Annals of neurology. 2007;62:278–287. - PubMed
Publication types
MeSH terms
Substances
Grants and funding
LinkOut - more resources
Full Text Sources
Other Literature Sources
