Comparative Study
. 2012 Feb 1;32(5):1660-71.
doi: 10.1523/JNEUROSCI.4608-11.2012.

Noise overexposure alters long-term somatosensory-auditory processing in the dorsal cochlear nucleus--possible basis for tinnitus-related hyperactivity?

Affiliations
Comparative Study

Noise overexposure alters long-term somatosensory-auditory processing in the dorsal cochlear nucleus--possible basis for tinnitus-related hyperactivity?

Susanne Dehmel et al. J Neurosci. .

Abstract

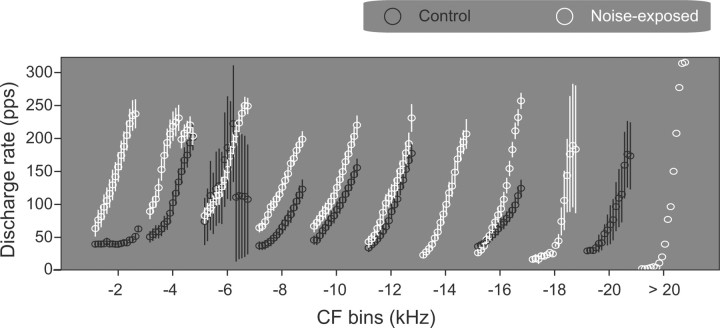
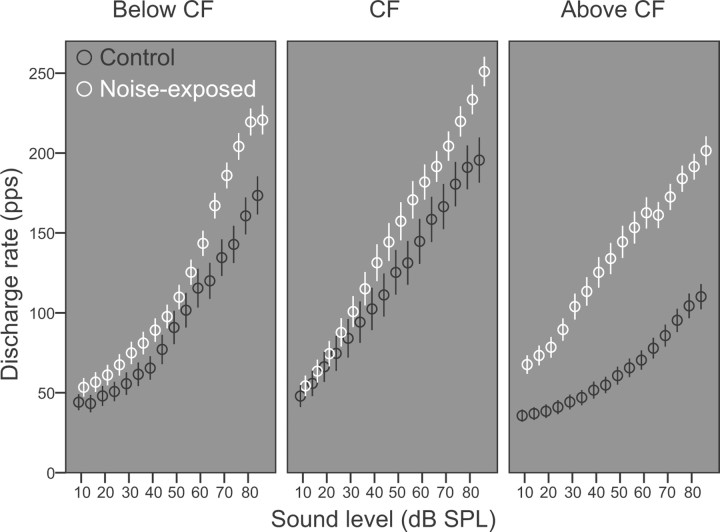
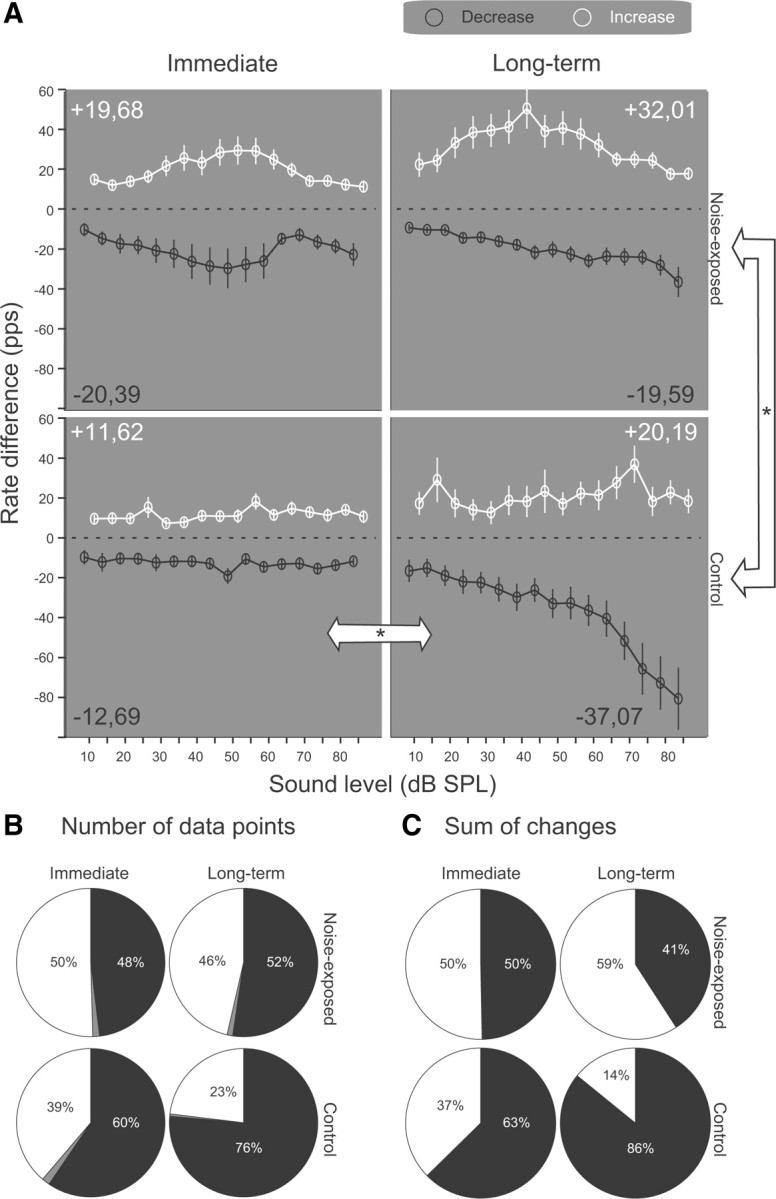
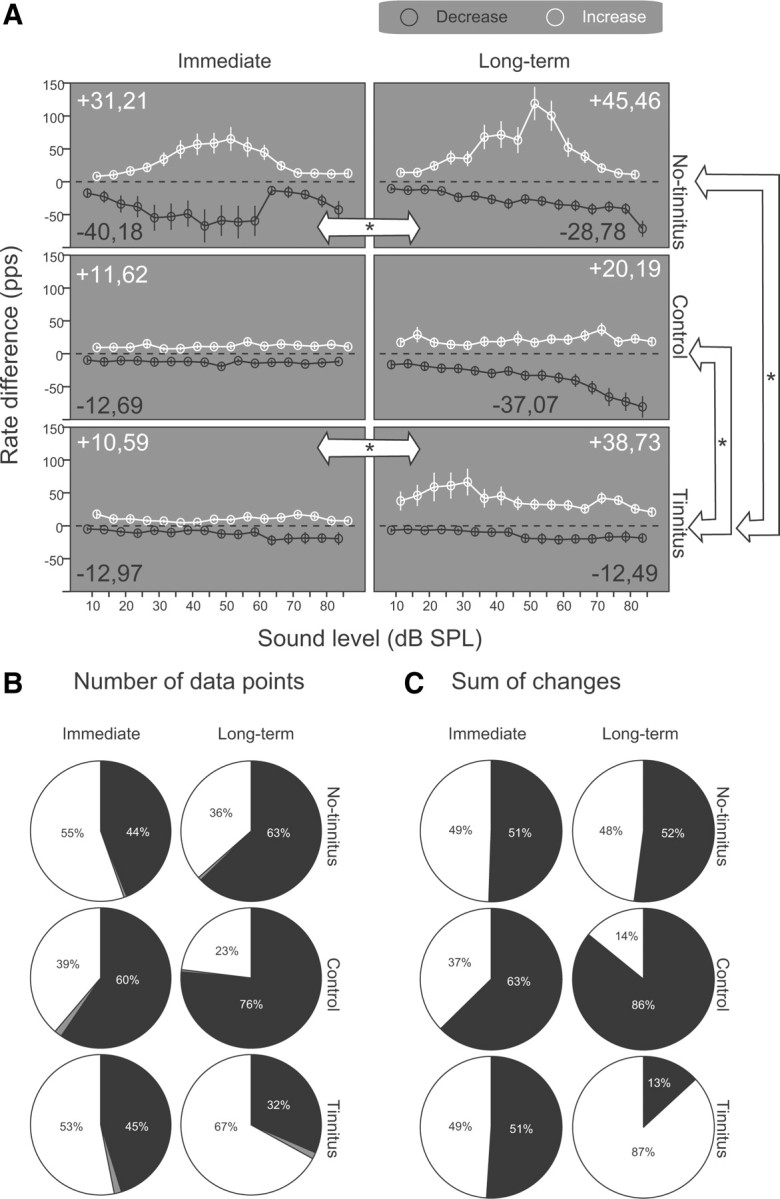
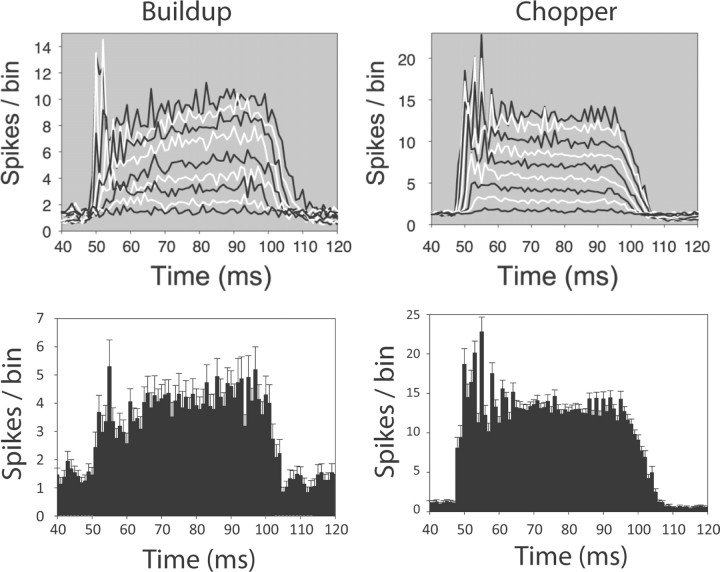
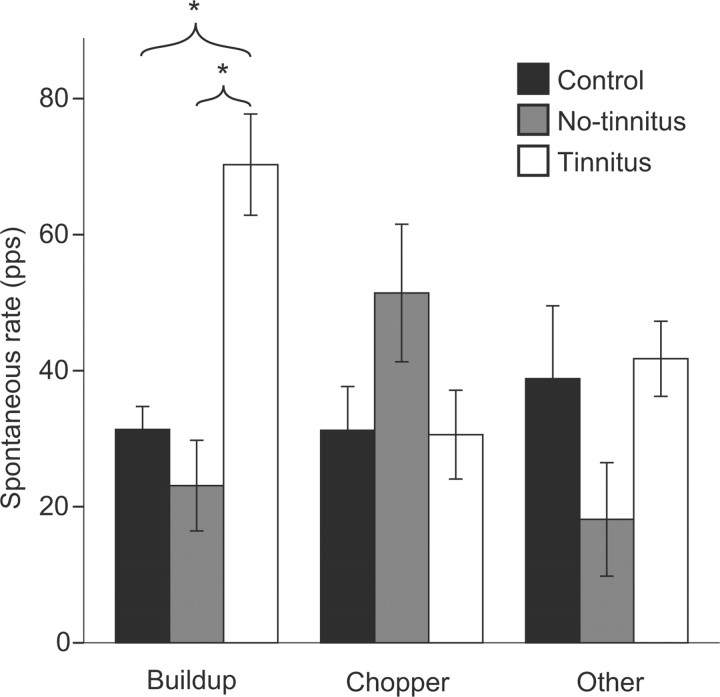
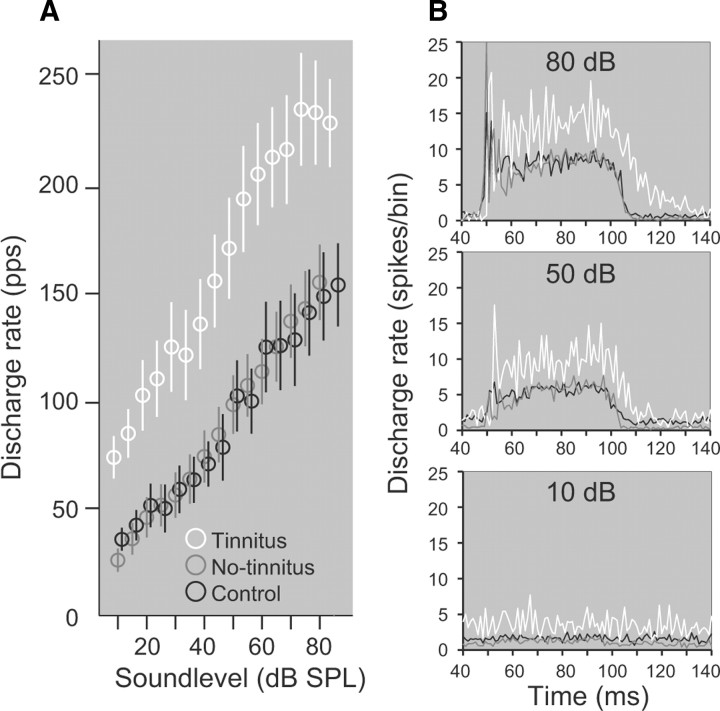
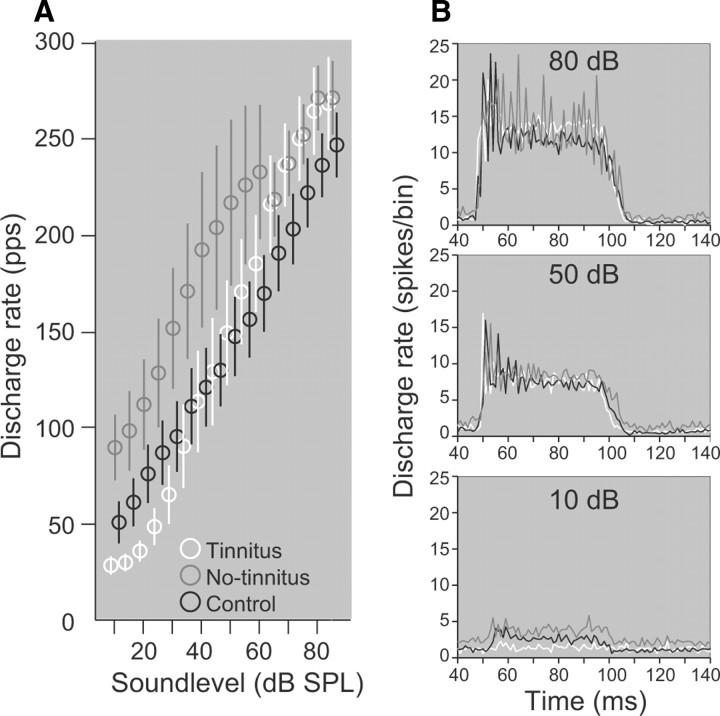
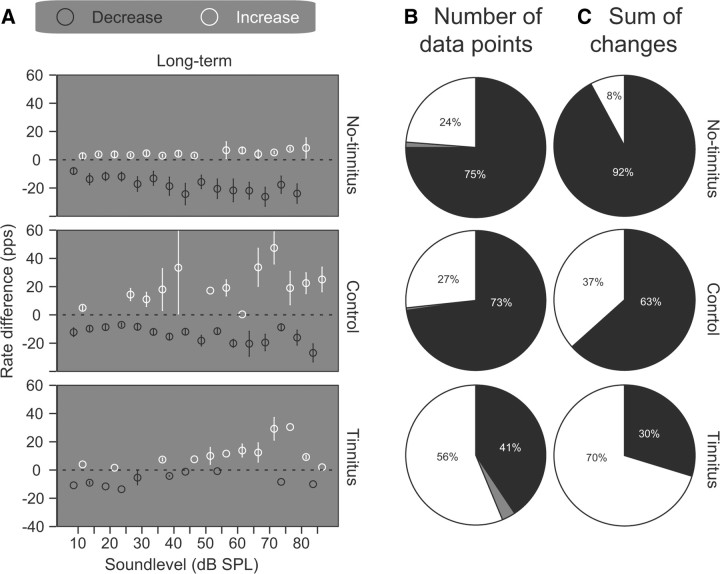
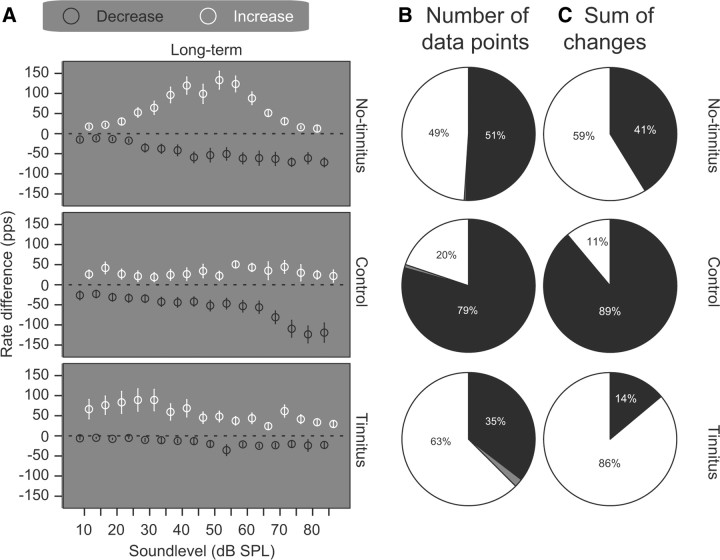
The dorsal cochlear nucleus (DCN) is the first neural site of bimodal auditory-somatosensory integration. Previous studies have shown that stimulation of somatosensory pathways results in immediate suppression or enhancement of subsequent acoustically evoked discharges. In the unimpaired auditory system suppression predominates. However, damage to the auditory input pathway leads to enhancement of excitatory somatosensory inputs to the cochlear nucleus, changing their effects on DCN neurons (Shore et al., 2008; Zeng et al., 2009). Given the well described connection between the somatosensory system and tinnitus in patients we sought to determine whether plastic changes in long-lasting bimodal somatosensory-auditory processing accompany tinnitus. Here we demonstrate for the first time in vivo long-term effects of somatosensory inputs on acoustically evoked discharges of DCN neurons in guinea pigs. The effects of trigeminal nucleus stimulation are compared between normal-hearing animals and animals overexposed with narrow band noise and behaviorally tested for tinnitus. The noise exposure resulted in a temporary threshold shift in auditory brainstem responses but a persistent increase in spontaneous and sound-evoked DCN unit firing rates and increased steepness of rate-level functions. Rate increases were especially prominent in buildup units. The long-term somatosensory enhancement of sound-evoked responses was strengthened while suppressive effects diminished in noise-exposed animals, especially those that developed tinnitus. Damage to the auditory nerve is postulated to trigger compensatory long-term synaptic plasticity of somatosensory inputs that might be an important underlying mechanism for tinnitus generation.


Figures

Figure 1.
Figure 1.
Schematic of the gap detection test. The startle noise pulse elicits a startle movement of the guinea pig (top row) that is reduced when a gap in the background noise band is preceding the startle noise pulse (middle row). Tinnitus that is spectrally similar to the background noise masks the gap and increases the startle movement (bottom row), as the animals cannot detect the gap (Turner et al., 2006).
Figure 2.
Figure 2.
Schematic of the bimodal stimulation paradigm. The immediate effect of bimodal stimulation was derived from a tone RLF and an immediately following bimodal RLF (in which the Sp5 stimulus preceded each tone stimulus). The long-term effect of the bimodal stimulation is derived from the comparison between the first tone RLF and a second tone RLF recorded later in time after the bimodal RLF. For clarity, the stimulus and response are shown only for one tone level of the RLF, which incorporated levels between 0 and 85 in 5 dB steps with 50 repetitions per level.
Figure 3.
Figure 3.
Narrow band noise exposure causes temporary threshold shift but permanently elevated spontaneous rates. The exposure-noise spectrum (gray area) is compared with the immediate threshold shift within an hour after the noise exposure (black symbols; mean and SD of 6 animals/10 ABRs of first and second noise exposures). Due to the considerable length of the noise exposure and ABR recordings, ABRs immediately after the noise exposure could not be recorded for all exposed animals. ABR threshold shift on the day of the DCN recordings (10–21 d after the second noise exposure) has recovered toward 0 dB (white circles, left exposed ear; white triangles, right ear; 11 animals), while SRs were elevated (red graph; control: 9 animals/135 units; noise-exposed: 12 animals/296 units). Black stars indicate significant differences for ABR shifts (p < 0.001; for details see Results), red crosses indicate significance for SR differences (p < 0.05, for details see Results). Box around 8–18 kHz labels the tinnitus frequencies (Fig. 4). Red numbers at the x-axis are N for each bin of spontaneous rate differences given for control/noise exposed animals (n/n).
Figure 4.
Figure 4.
Narrow band noise exposure results in tinnitus in the 8–18 kHz band. Animals with noise exposure were divided into two groups: those with no significant gap detection in gap-carrier bands 8–18 kHz—“tinnitus group,” and those with significant gap detection at all carrier bands—“no-tinnitus group.” A, B, Gap-PPI; C, D, noise pulse-PPI. A, C, The normalized startle (startle with the gap or noise pulse/startle without the gap or noise pulse) is shown for the two noise-exposure groups and the control group after the noise/sham exposure. The dotted line designates a normalized startle of 1, i.e., the startle amplitude without gap or noise pulse. B, D, Dot plot of the absolute startle without the gap (black symbols) and with the gap (white symbols). The mean and 95% confidence intervals are shown as dotted horizontal lines below and above the mean. The mean + 95% confidence interval of the noise-floor is given for each group as a line plot (black: control, white: tinnitus, gray: no-tinnitus). Black bars, circles: sham exposure control group (n = 4 animals), white bars, triangles: tinnitus group (n = 4 animals), gray bars, squares: no-tinnitus group (n = 3 animals). Normalized startle responses were derived from the mean of all trials over 4 d of one animal with the gap normalized to the mean of all trials of one animal without the gap. Stars mark significance in two-way repeated-measures ANOVA (p < 0.05, for details, see Results).
Figure 5.
Figure 5.
Suprathreshold discharge rates remain elevated after recovery from temporary threshold shift. RLFs of noise exposed animals are steeper and show higher discharge rates across levels. Mean and SE of rate level functions (10–85 dB, in 5 dB steps) are shown within 2 kHz bins of the characteristic frequency of the unit, included are RLFs recorded below/at/above the CF of the unit. White symbols, noise-exposed animals (n = 11 animals/463 RLFs); black symbols, control animals (n = 9 animals/252 RLFs).
Figure 6.
Figure 6.
Effect of noise exposure on suprathreshold tone discharge rates. Mean RLFs recorded at unit CF (−0.1 up to 0.0 octaves around CF) and below/above CF. RLFs of units with all CFs pooled. Control animals (black symbols; below CF, n = 8 animals/84 RLFs; at CF, n = 8 animals/50 RLFs; above CF, n = 9 animals/118 RLFs) are compared with noise-exposed animals (white symbols; below CF, n = 11 animals/153 RLFs; at CF, n = 11 animals/109 RLFs; above CF, n = 11 animals/201 RLFs).
Figure 7.
Figure 7.
Effect of noise exposure on the balance between bimodal enhancement and suppression. A, Left, Immediate rate differences between tone RLFs and immediately following bimodal RLFs (control: n = 8 animals/50 RLFs, noise-exposed: n = 11 animals/108 RLFs). All RLFs were recorded at the units' CF. Right, Long-term rate differences between the first tone RLF and a second tone RLF recorded later in time after bimodal stimulation (control, n = 8 animals/49 RLFs; noise-exposed, n = 10 animals/93 RLFs). The mean and SE are shown for suppression i.e., reduction of the discharge rate (black dots) and enhancement i.e., increase of discharge rate (white dots). The mean across level is given as a black or white number in the graph. Noise-exposed and control animals are shown in the top and bottom, respectively. Star and arrow marks significant difference (linear mixed model statistics, adjustment for multiple comparisons: Sidak, p < 0.05; for details see Materials and Methods, Data analysis). Data of A are collapsed across sound levels as pie charts in B and C. B, The number of data points with enhancement (white slices) or suppression (black slices) or no change (gray slices). C, The sum of immediate and long-term rate differences (sum of rate difference from all units at all levels from 10 to 85 dB) for noise-exposed and control animals. Colors as in B.
Figure 8.
Figure 8.
Tinnitus is accompanied by a strengthening of bimodal enhancement. A, Rate differences (1) between RLFs during unimodal tone stimulation and immediately following RLFs during bimodal tone and somatosensory stimulation (“immediate” change): control, n = 8 animals/50 RLFs; no-tinnitus, n = 3 animals/39 RLFs; tinnitus, n = 4 animals/30 RLFs and (2) between the first unimodal tone RLFs and a second tone RLFs repeated later in time (Long-term): control, n = 8 animals/49 RLFs; no-tinnitus, n = 3 animals/33 RLFs; tinnitus, 3 animals/25 RLFs. All RLFs were recorded at the units' CF. The pie charts show the number of data points (B) and the summed immediate and long-term rate difference of the data (C). Compared are control animals with noise-exposed animals that developed tinnitus or with noise-exposed animals that did not develop tinnitus. Stars and arrows mark significant differences (linear mixed model statistics, adjustment for multiple comparisons: Sidak, p < 0.05; see Materials and Methods, Data analysis). For a detailed description see Figure 7 legend.
Figure 9.
Figure 9.
Predominant temporal response types were buildup and chopper. Poststimulus time histograms (PSTHs) were determined from RLFs at the unit CF. Population (mean) PSTHs of the two main response types buildup (left) and chopper (right) are shown in the top panels. Levels between 10 dB and 90 dB are indicated with alternating black and white line plots. Bottom shows single level group PSTHs (mean and SD) at 35 dB for buildup and 85 dB for chopper. The buildup response was most characteristic at lower levels and accompanied by onset components at higher levels (left). The precision of the chopping response increased with level (right).
Figure 10.
Figure 10.
Spontaneous rates are increased in buildup units of animals with tinnitus. Mean and SE of SRs of control animals (black), noise-exposed tinnitus animals (white) and no-tinnitus animals (gray) are plotted for the main response types. Stars indicate significant differences in ANOVA (p < 0.05, adjustment for multiple comparisons: Sidak; for details, see Results). Buildup control: n = 5 animals/12 units, buildup no-tinnitus: n = 2 animals/12 units, buildup tinnitus: n = 2 animals/7 units, chopper control: n = 5 animals/23 units, chopper no-tinnitus: n = 2 animals/17 units, chopper tinnitus: n = 3 animals/15 units, other control: n = 6 animals/16 units, other no-tinnitus: n = 3 animals/3 units, other tinnitus: n = 3 animals/8 units.
Figure 11.
Figure 11.
Buildup units in tinnitus animals show elevated tone responses. A, B, Population rate level functions (A) and PSTHs (B) of buildup units in control animals (black plots) and noise-exposed animals that developed tinnitus (white plots) and those that did not develop tinnitus (gray plots). PSTHs are shown for 10, 50, and 80 dB. Tinnitus, n = 2 animals/7 units; no-tinnitus, n = 2 animals/16 units; control, n = 5 animals/11 units.
Figure 12.
Figure 12.
Chopper units in tinnitus animals do not show elevated tone-responses. A, B, Population RLFs (A) and PSTHs (B). For details see legend of Figure 11. The elevation of rates for no-tinnitus animals were not significant. Tinnitus, n = 3 animals/15 units; no-tinnitus, n = 2 animals/19 units; control, n = 5 animals/23 units.
Figure 13.
Figure 13.
Long-term somatosensory (bimodal) effects in buildup units are predominated by enhancement in tinnitus animals. A, Rate differences between the first unimodal tone RLFs and a second tone RLFs repeated later in time: control, n = 5 animals/11 RLFs; no-tinnitus, n = 2 animals/16 RLFs; tinnitus, n = 1 animal/2 RLFs. All RLFs were recorded at the units' CF. B, C, The pie charts show the number of data points (B) and the summed rate difference (C). Control animals are compared with noise-exposed animals that developed tinnitus or with noise-exposed animals that did not develop tinnitus. Suppression, i.e., a reduction of discharge rate, is shown as black plots or pies and enhancement, i.e., increase of discharge rate, as white plots or pies. For a detailed description see legend of Figure 7.
Figure 14.
Figure 14.
Chopper units show predominant long-term somatosensory enhancement in tinnitus and no-tinnitus animals. A, Long-term rate differences across level: control, n = 5 animals/23 RLFs; no-tinnitus, n = 2 animals/15 RLFs; tinnitus, n = 3 animals/15 RLFs. All RLFs were recorded at the units' CF. B, C, Number of data points (B) and the summed rate difference (C). Compared are control animals with noise-exposed animals that developed tinnitus or with noise-exposed animals that did not develop tinnitus. Suppression, i.e., a reduction of discharge rate, is shown as black plots or pies and enhancement, i.e., increase of discharge rate, as white plots or pies. For a detailed description see legend of Figure 7.

Similar articles

Cited by

References

    1. Anari M, Axelsson A, Eliasson A, Magnusson L. Hypersensitivity to sound. Scand Audiol. 1999;28:219–230. - PubMed
    1. Bell CC. Duration of plastic change in a modifiable efference copy. Brain Res. 1986;369:29–36. - PubMed
    1. Bell CC. Memory-based expectations in electrosensory systems. Curr Opin Neurobiol. 2001;11:481–487. - PubMed
    1. Bell CC, Han V, Sawtell NB. Cerebellum-like structures and their implications for cerebellar function. Annu Rev Neurosci. 2008;31:1–24. - PubMed
    1. Bell C, Bodznick D, Montgomery J, Bastian J. The generation and subtraction of sensory expectations within cerebellum-like structures. Brain Behav Evol. 1997;50(Suppl 1):17–31. - PubMed

Publication types