

A genome-wide association scan on the levels of markers of inflammation in Sardinians reveals associations that underpin its complex regulation
- PMID: 22291609
- PMCID: PMC3266885
- DOI: 10.1371/journal.pgen.1002480
A genome-wide association scan on the levels of markers of inflammation in Sardinians reveals associations that underpin its complex regulation
Abstract
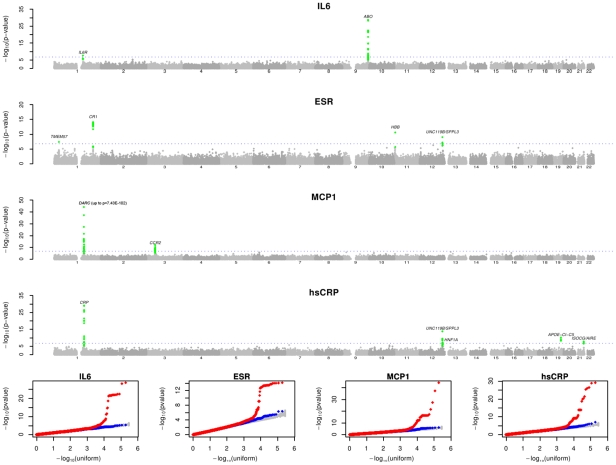
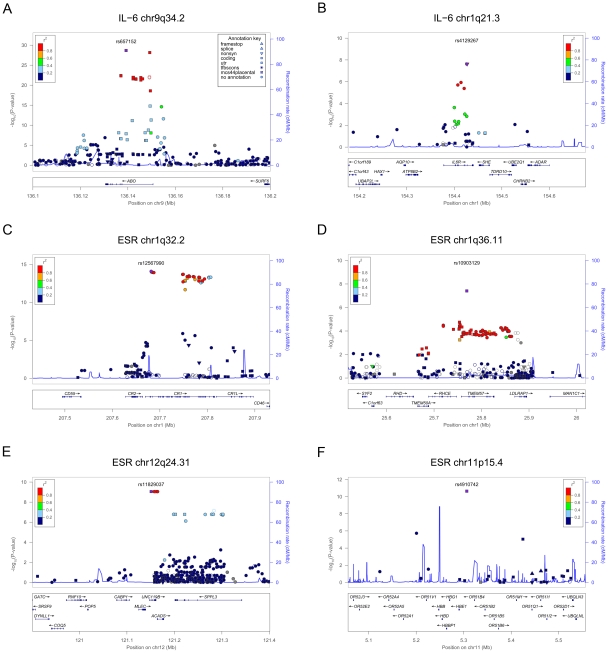
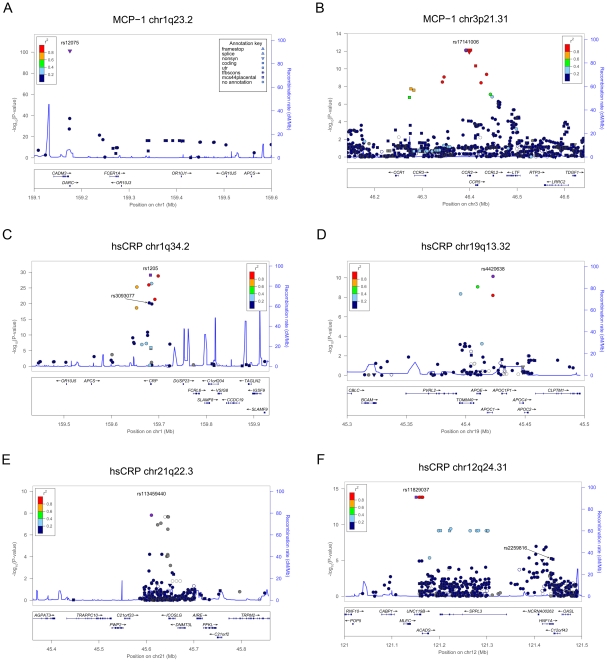
Identifying the genes that influence levels of pro-inflammatory molecules can help to elucidate the mechanisms underlying this process. We first conducted a two-stage genome-wide association scan (GWAS) for the key inflammatory biomarkers Interleukin-6 (IL-6), the general measure of inflammation erythrocyte sedimentation rate (ESR), monocyte chemotactic protein-1 (MCP-1), and high-sensitivity C-reactive protein (hsCRP) in a large cohort of individuals from the founder population of Sardinia. By analysing 731,213 autosomal or X chromosome SNPs and an additional ∼1.9 million imputed variants in 4,694 individuals, we identified several SNPs associated with the selected quantitative trait loci (QTLs) and replicated all the top signals in an independent sample of 1,392 individuals from the same population. Next, to increase power to detect and resolve associations, we further genotyped the whole cohort (6,145 individuals) for 293,875 variants included on the ImmunoChip and MetaboChip custom arrays. Overall, our combined approach led to the identification of 9 genome-wide significant novel independent signals-5 of which were identified only with the custom arrays-and provided confirmatory evidence for an additional 7. Novel signals include: for IL-6, in the ABO gene (rs657152, p = 2.13×10(-29)); for ESR, at the HBB (rs4910472, p = 2.31×10(-11)) and UCN119B/SPPL3 (rs11829037, p = 8.91×10(-10)) loci; for MCP-1, near its receptor CCR2 (rs17141006, p = 7.53×10(-13)) and in CADM3 (rs3026968, p = 7.63×10(-13)); for hsCRP, within the CRP gene (rs3093077, p = 5.73×10(-21)), near DARC (rs3845624, p = 1.43×10(-10)), UNC119B/SPPL3 (rs11829037, p = 1.50×10(-14)), and ICOSLG/AIRE (rs113459440, p = 1.54×10(-08)) loci. Confirmatory evidence was found for IL-6 in the IL-6R gene (rs4129267); for ESR at CR1 (rs12567990) and TMEM57 (rs10903129); for MCP-1 at DARC (rs12075); and for hsCRP at CRP (rs1205), HNF1A (rs225918), and APOC-I (rs4420638). Our results improve the current knowledge of genetic variants underlying inflammation and provide novel clues for the understanding of the molecular mechanisms regulating this complex process.
Conflict of interest statement
The authors have declared that no competing interests exist.
Figures
Similar articles
-
Bivariate genome-wide association study identifies novel pleiotropic loci for lipids and inflammation.BMC Genomics. 2016 Jun 10;17:443. doi: 10.1186/s12864-016-2712-4. BMC Genomics. 2016. PMID: 27286809 Free PMC article.
-
Genome-wide association analysis of blood biomarkers in chronic obstructive pulmonary disease.Am J Respir Crit Care Med. 2012 Dec 15;186(12):1238-47. doi: 10.1164/rccm.201206-1013OC. Epub 2012 Nov 9. Am J Respir Crit Care Med. 2012. PMID: 23144326 Free PMC article. Clinical Trial.
-
Discovery, fine-mapping, and conditional analyses of genetic variants associated with C-reactive protein in multiethnic populations using the Metabochip in the Population Architecture using Genomics and Epidemiology (PAGE) study.Hum Mol Genet. 2018 Aug 15;27(16):2940-2953. doi: 10.1093/hmg/ddy211. Hum Mol Genet. 2018. PMID: 29878111 Free PMC article.
-
Genome-wide associated loci influencing interleukin (IL)-10, IL-1Ra, and IL-6 levels in African Americans.Immunogenetics. 2012 May;64(5):351-9. doi: 10.1007/s00251-011-0596-7. Epub 2011 Dec 29. Immunogenetics. 2012. PMID: 22205395 Free PMC article.
-
C-reactive protein, cytokines and inflammation in cardiovascular diseases.Bratisl Lek Listy. 2008;109(8):333-40. Bratisl Lek Listy. 2008. PMID: 18837239 Review.
Cited by
-
CRP gene polymorphism contributes genetic susceptibility to dyslipidemia in Han Chinese population.Mol Biol Rep. 2014;41(4):2335-43. doi: 10.1007/s11033-014-3087-8. Epub 2014 Jan 29. Mol Biol Rep. 2014. PMID: 24474658
-
Update on clinical screening of maturity-onset diabetes of the young (MODY).Diabetol Metab Syndr. 2020 Jun 8;12:50. doi: 10.1186/s13098-020-00557-9. eCollection 2020. Diabetol Metab Syndr. 2020. PMID: 32528556 Free PMC article. Review.
-
Genome-wide association analyses based on whole-genome sequencing in Sardinia provide insights into regulation of hemoglobin levels.Nat Genet. 2015 Nov;47(11):1264-71. doi: 10.1038/ng.3307. Epub 2015 Sep 14. Nat Genet. 2015. PMID: 26366553 Free PMC article.
-
Inflammatory Genotype Moderates the Association Between Anxiety and Systemic Inflammation in Adults at Risk for Cardiovascular Disease.J Cardiovasc Nurs. 2022 Jan-Feb 01;37(1):64-72. doi: 10.1097/JCN.0000000000000742. J Cardiovasc Nurs. 2022. PMID: 32769481 Free PMC article.
-
Association between ABO blood group and risk of Crohn's disease: A case-control study in the Chinese Han population.J Clin Lab Anal. 2022 Feb;36(2):e24195. doi: 10.1002/jcla.24195. Epub 2021 Dec 24. J Clin Lab Anal. 2022. PMID: 34952990 Free PMC article.
References
-
- Dupuis J, Larson MG, Vasan RS, Massaro JM, Wilson PW, et al. Genome scan of systemic biomarkers of vascular inflammation in the Framingham Heart Study: evidence for susceptibility loci on 1q. Atherosclerosis. 2005;182:307–314. - PubMed
Publication types
MeSH terms
Substances
Grants and funding
LinkOut - more resources
Full Text Sources
Research Materials
Miscellaneous
