. 2012 Jan 30:10:4.
doi: 10.1186/1741-7007-10-4.

Single vesicle imaging indicates distinct modes of rapid membrane retrieval during nerve growth

Affiliations

Single vesicle imaging indicates distinct modes of rapid membrane retrieval during nerve growth

Jacob H Hines et al. BMC Biol. .

Abstract

Background: During nerve growth, cytoplasmic vesicles add new membrane preferentially to the growth cone located at the distal tip of extending axons. Growth cone membrane is also retrieved locally, and asymmetric retrieval facilitates membrane remodeling during growth cone repulsion by a chemorepellent gradient. Moreover, growth inhibitory factors can stimulate bulk membrane retrieval and induce growth cone collapse. Despite these functional insights, the processes mediating local membrane remodeling during axon extension remain poorly defined.

Results: To investigate the spatial and temporal dynamics of membrane retrieval in actively extending growth cones, we have used a transient labeling and optical recording method that can resolve single vesicle events. Live-cell confocal imaging revealed rapid membrane retrieval by distinct endocytic modes based on spatial distribution in Xenopus spinal neuron growth cones. These modes include endocytic "hot-spots" triggered at the base of filopodia, at the lateral margins of lamellipodia, and along dorsal ridges of the growth cone. Additionally, waves of endocytosis were induced when individual filopodia detached from the substrate and fused with the growth cone dorsal surface or with other filopodia. Vesicle formation at sites of membrane remodeling by self-contact required F-actin polymerization. Moreover, bulk membrane retrieval by macroendocytosis correlated positively with the substrate-dependent rate of axon extension and required the function of Rho-family GTPases.

Conclusions: This study provides insight into the dynamic membrane remodeling processes essential for nerve growth by identifying several distinct modes of rapid membrane retrieval in the growth cone during axon extension. We found that endocytic membrane retrieval is intensified at specific subdomains and may drive the dynamic membrane ruffling and re-absorption of filopodia and lamellipodia in actively extending growth cones. The findings offer a platform for determining the molecular mechanisms of distinct endocytic processes that may remodel the surface distribution of receptors, ion channels and other membrane-associated proteins locally to drive growth cone extension and chemotactic guidance.


Figures

Figure 1
Figure 1
Focal endocytic assay. (A) Illustration of the focal FM 5-95 membrane labeling assay. A focal pulse delivered from a micropipette containing FM 5-95 labels the growth cone plasma membrane. During subsequent membrane retrieval events, the lipophilic dye is trapped inside nascent vesicles. The surface membrane destains rapidly, revealing single endocytic vesicles. (B) Using a similar approach as in (A), fluorescent dextran is focally applied from a micropipette. Seconds later, a second micropipette containing buffered saline washes away the uninternalized fluorescent dextran, revealing nascent dextran-containing endocytic vesicles. (C-D) Confocal images of the same growth cone show nascent dye-containing vesicles 10 s after the focal pulse. The labeling micropipette contained both FM 5-95 (C) and Alexa488 conjugated dextran (D). The yellow arrowheads indicate endocytic vesicles exhibiting strong co-labeling. Scale bar, 5 μm.
Figure 2
Figure 2
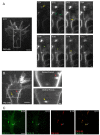
Small endocytic vesicle hot-spots at dorsal ridges of the growth cone. (A-B) Time-lapse confocal images of FM 5-95 internalization show numerous small endocytic vesicles that form at dye-labeled dorsal ridges of the growth cone. For each example (A-B), the frame showing initial membrane labeling immediately following the focal dye pulse is shown at the left (0:01). The boxed regions (left panels) are shown at higher magnification in the right panels. Time, following the initial membrane labeling, is indicated for each frame in minutes:seconds. In each example, the peripheral filopodia are slightly below the dorsal focal plane in the confocal section. Note the radial progression (inside-out) of endocytic vesicle formation, which is indicated by the yellow arrowheads marking nascent vesicles. Time-lapse movies are shown in Additional file 1. Scale bars, 5 μm (left), 1 μm (right).
Figure 3
Figure 3
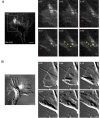
Small endocytic vesicle hot-spots at the lateral margins of lamellipodia. (A) Time-lapse confocal images of FM 5-95 internalization show endocytosis at the lateral margin of a lamellipodium as the growth cone narrows. The boxed area is magnified in the panels on the right and the time after the initial membrane labeling (minutes:seconds) is indicated in each frame. The static dashed line represents the lamellipodial margin at t = 0:07. In subsequent frames, the lamellipodium remodels to form a dye-rich membrane ruffle (red arrows, 0:19, 0:21). Within seconds, numerous small vesicles form (yellow arrowheads, frames 0:22, 0:23). The corresponding time-lapse movie is shown in Additional file 2. (B) Similar ridge formation at a lamellipodial lateral margin observed by time-lapse DIC microscopy. See Additional file 3 for the corresponding time-lapse movie. Scale bars, 5 μm (left), 1 μm (right).
Figure 4
Figure 4
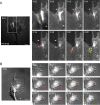
Small vesicle endocytic hot-spots triggered by filopodial - lamellipodial contacts. (A) Time-lapse confocal images of FM 5-95 internalization show a detached filopodium collapse atop the dorsal surface of the growth cone and trigger an endocytic hot-spot. The boxed region is magnified in the right panels and the time after the initial membrane labeling (minutes:seconds) is indicated in each frame. The dashed arrows (white) are static and indicate the initial position of the filopodium. The detached filopodium lifts out of the focal plane (0:15 to 0:20, red arrows) and within seconds collapses atop the growth cone body (yellow bracket, 0:21), eliciting a streak of small vesicles (yellow arrowheads, 0:22). See Additional file 4 for the corresponding time-lapse movie. (B) Time-lapse DIC images show a similar loss of filopodia atop the dorsal surface of the growth cone. Detached filopodia (blue and red arrows) approach lamellipodia and rapidly disappear. One filopodium (red arrow) lifts out of the focal plane (0:46 to 56), collapses atop a lamellipodium (0:58 to 1:06), and disappears as in (A). The corresponding time-lapse movie is shown in Additional file 5. Scale bars, 5 μm (left), 1 μm (right).
Figure 5
Figure 5
Small vesicle endocytic hot-spots triggered by filopodial contact. (A) Time-lapse confocal images of FM 5-95 internalization show contact and apparent fusion between adjacent filopodia (red arrows). The boxed area is magnified in the panels at the right and the time after the initial membrane labeling (minutes:seconds) is indicated in each frame. The dashed arrows (white) are static and indicate the initial position of filopodia. Filopodial contact and fusion is accompanied by the formation of multiple small endocytic vesicles at the proximal region of the resulting filopodium (yellow arrowheads). See Additional file 6 for the corresponding time-lapse movie. (B) Time-lapse DIC images show similar filopodial-filopodial contacts (red arrows) as in (A). The dashed arrows (white) depict the initial filopodial position. The corresponding time-lapse movie is shown in Additional file 7. Scale bars, 5 μm (left), 1 μm (right).
Figure 6
Figure 6
Small vesicle endocytic hot-spots triggered by lamellipodial contact. (A) Time-lapse confocal images of FM 5-95 internalization show an endocytic hot-spot where adjacent processes contact one another. The boxed area is magnified in the panels at the right and the time after the initial membrane labeling (mintes:seconds) is indicated in each frame. Lamellipodial contacts near the base of filopodia (red arrows) result in the formation of several small vesicles (yellow arrowheads) and subsequent membrane reshaping. For the corresponding time-lapse movie see Additional file 8. (B-C) Time-lapse DIC images show similar lamellipodial contacts and membrane remodeling as in (A). Note the contact between adjacent membrane processes (B, white arrows). The blue arrowheads indicate structures highly reminiscent of the reverse shadowcast vacuoles reported by Dailey and Bridgman [35]. See Additional file 9 for the time-lapse movie corresponding to Figure 6B, C. Scale bars, 5 μm (left), 1 μm (right).
Figure 7
Figure 7
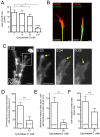
Endocytic vesicle formation at self-membrane contacts requires F-actin. (A) Summary of axon growth rates in vehicle treated controls and after treatment with cytochalasin D during a one-hour growth assay. Data are the mean ± standard error of the mean and the number of axons measured is indicated for each condition. N.S. (no significant difference), P > 0.05, *P < 0.0001, One-way ANOVA, Tukey's post-test. (B) Representative confocal images of control (DMSO) and cytochalasin D (CytoD, 30 nM) treated growth cones show the distribution of F-actin and microtubules, as detected by Alexa555-phalloidin (red) and anti-β-tubulin immunolabeling (green). Note the fewer peripheral processes and reduced F-actin after CytoD. Scale bar, 5 μm. (C) Time-lapse confocal images after a FM 5-95 dye pulse show a motile filopodium (yellow arrows) contacting and fusing with the growth cone peripheral plasma membrane. The self-membrane contact fails to trigger vesicle formation. The boxed region is magnified in the right panels and the time (minutes:seconds) after the initial membrane labeling is indicated in each frame. The corresponding time-lapse movie is shown in Additional file 10. Scale bars, 5 μm. (D-E) Quantitative analysis of membrane retrieval at self-membrane contact sites (filopodial - lamellipodial and filopodial - filopodial contacts) in untreated and cytochalasin D-treated (30 nM) growth cones. The percentage of total self-membrane contact sites associated with membrane retrieval is shown in (D), and the frequency of membrane retrieval events (per minute) occurring at self-membrane contact sites is shown in (E). (F) Frequency (per minute) measurements for the total number of self-membrane contact events, including those not associated with membrane retrieval, measured during the focal membrane labeling assays. For (D-F), data are the mean ± standard error of the mean and the number of growth cones is indicated for each bar. N.S., P > 0.05, **P < 0.01, t-test.
Figure 8
Figure 8
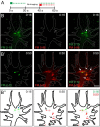
Sequential dye labeling demonstrates temporally distinct endocytic zones. (A) Illustration of the dual FM dye membrane labeling assay. A micropipette first applied a focal pulse of FM 2-10 (green square, t = 0 s) and confocal images were collected for 20 s. After an additional 20 s interval, a second micropipette applied a focal pulse of FM 5-95 at time 40 s (red square) and confocal images were collected for an additional 20 s. The broken lines depict the presence of the respective FM dyes. (B-C) Time-lapse confocal images of a representative growth cone subjected to the dual FM dye labeling assay described in (A). (B) Confocal images of FM 2-10 internalization following the initial dye pulse, applied at t = 0:00, show labeled endocytic structures in the growth cone. The white arrowhead marks an endocytic zone. Time (minutes:seconds) following the FM 2-10 pulse is depicted in each frame. (B') Confocal images of the same growth cone following a second dye pulse (FM 5-95, red) show dye labeled nascent vesicles, most of which were not labeled by the prior FM 2-10 pulse. Importantly, the majority of nascent vesicles labeled by FM 5-95 (right panel, white arrows) formed in locations spatially distinct from regions where FM 2-10-positive vesicles had formed (right panel, white arrowhead). Time (min:s) following the initial FM 2-10 dye pulse is indicated in each frame. (B'') Binary images, generated from the fluorescence images in B (0:16) and B' (0:50), show distinct endocytic zones during the two FM dye pulses applied at 40-s intervals. See Additional file 11 for the time-lapse movie corresponding to B-B''. Scale bars, 5 μm.
Figure 9
Figure 9
Endocytosis of elongated tubules in the growth cone periphery. (A) Time-lapse confocal images of FM 5-95 internalization show immediate dye incorporation into an elongated tubule (yellow static arrow) near the base of a filopodium. In subsequent frames, the endocytic tubule is transported retrogradely toward the growth cone central domain. The boxed area is magnified in the panels at the right and the time after the initial membrane labeling (minutes:seconds) is indicated in each frame. See Additional file 8. (B) Time-lapse confocal images of fluorescent dextran internalization show similar endocytosis of an elongated tubule (red arrows) near the base of a filopodium. The focal pulse (10 s) of fluorescent dextran was applied at 0:00 and the initial frame shows nascent endocytic vesicles immediately after the removal of uninternalized dextran (0:15). Endocytic vesicles originating in the peripheral domain move retrogradely and fuse with other dextran-containing vesicles near the transitional- or central domains of the growth cone within one minute. See Additional file 12. Scale bars, 5 μm (left), 1 μm (right).
Figure 10
Figure 10
Endocytic tubules and vacuoles in the growth cone central domain. (A) Time-lapse confocal images of FM 5-95 internalization show dye incorporation into elongated tubules (green arrows, 0:02) and vacuoles (yellow arrows, 0:01 to 0:03) that correspond to the timing of surface membrane labeling. Tubules (green arrowheads, 0:06 to 0:08) and vacuoles are most often stationary but occasionally become motile and contact one another (yellow asterisk, 0:10 to 0:12). See Additional file 13 for the corresponding time-lapse movie. (B) Confocal images show FM 5-95 labeled vacuoles associated with dorsal (red arrow) and ventral (yellow arrow) surface membranes. The boxed region on the left is magnified at the right, which shows two different confocal z-sections of the same growth cone. Dye-labeled vacuoles are either seen in the dorsal (upper magnified panel) or ventral (lower magnified panel) confocal sections of the growth cone. The numerous vesicles in the upper-right lamellipodium of the far left panel originated from small vesicle hot-spots. Scale bars, 5 μm (left), 1 μm (right). (C) Time-lapse confocal images show that FM dye-labeled vacuoles are continuous with the plasma membrane for extended time periods. The time (minutes:seconds) following the initial dye pulse is indicated in each frame. In this modified dual-labeling assay, a first micropipette delivered a focal pulse of FM 2-10 at 0:00 (green, left panel), which rapidly labels several small vesicles and a vacuole (0:04, white arrow). A subsequent pulse of FM 5-95 (red), applied from a second micropipette at 0:12, incorporates into the same vacuole (0:14, white arrow). Scale bar, 5 μm.
Figure 11
Figure 11
Vacuole and tubule unloading or recycling back to the plasma membrane. (A) Time-lapse confocal images of FM 5-95 internalization show the disappearance of a vacuole in the growth cone central domain. Focally applied FM 5-95 (applied at 0:00) immediately incorporates into several vacuoles (0:02). In subsequent frames, one vacuole narrows (yellow arrows, 0:04) and later disappears (0:06 to 0:08). Note that the size and location of other nearby vacuoles remains unchanged (red arrowheads). (B) Time-lapse confocal images of fluorescent dextran internalization show sudden dye unloading by an elongated tubule in the growth cone periphery (yellow static arrows). The dextran pulse was applied at 0:00 and washed away from 0:10 to 0:15. Note that the labeled tubule disappears within 40 to 50 s of forming (0:51, yellow asterisk). (C) Time-lapse confocal images show rapid unloading of dextran-containing vesicles. The focal pulse was applied and washed away as in (B). Within 20 to 30 s of vesicle formation, nascent vesicles (yellow, red, blue static arrowheads) begin to unload dye. For all examples (A-C), the boxed regions in the left panels are shown at higher magnification on the right and the time after the focal dye pulse (minutes:seconds) is indicated in each frame. Time-lapse movies for (A-C) are shown in Additional file 14. Scale bars, 5 μm (left), 1 μm (right).
Figure 12
Figure 12
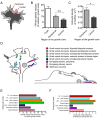
Distribution of endocytosis in the growth cone central and peripheral domains. (A) Schematic illustration of the growth cone peripheral and central regions (light and dark gray, respectively) used to determine the spatial distribution of endocytic vesicle formation (B-C). (B) Summary of the number of endocytic events in the indicated regions. Individual vesicles were counted 15 s after membrane labeling and classified based on their origin in peripheral or central regions as defined in (A). Colors (light and dark gray) correspond to (A). (C) Summary of the endocytic density in peripheral and central regions as defined in (A). Vesicles were counted as in (B) and the density reflects the number of endocytic vesicles per μm2. Data are the mean ± standard error of the mean obtained from 20 individual growth cones. N.S., P > 0.05, *P < 0.005, t-test. (D) Summary illustration of the endocytic modes described in Figures 2-10. A top-view (coronal section) of the growth cone is shown at the left. A side-view (sagittal section) is shown at the right where dorsal is up and ventral is down. The colors of labeled vesicles, tubules, and vacuoles correspond to the legend at the upper right. (E) Summary of the percentage of growth cones that displayed individual endocytic modes during the focal membrane labeling assays. The colors for each bar correspond to the legend and illustration in (A). (F) Summary of the frequency of individual endocytic modes observed during the FM dye assays. Spatial modes were counted in 20 individual growth cones and are displayed as the number of events per minute.
Figure 13
Figure 13
Endocytic activity correlates with axon outgrowth and requires Rho GTPases. (A) Summary of axon length measurements from spinal neuron cultures grown on poly-d-lysine (PDL) or PDL with fibronectin. (B) Summary of fluid-phase endocytosis levels measured in spinal neuron growth cones cultured on the indicated substrates. Fluorescent dextran was applied for 10 minutes and the amount of internalization was measured by fluorescence microscopy. The mean fluorescence intensity of each growth cone was normalized to the mean control (PDL). (C) Summary of growth rate measurements during the one-hour growth assays with or without pre-treatment with Toxin B (20 ng/ml). (D) Summary of fluid-phase endocytosis levels measured as in (B) under the indicated conditions. All data (A-D) are the mean ± standard error of the mean and the number of axons measured per condition is indicated in each bar. *P < 0.05, **P < 0.001, t-test or Mann-Whitney U-test (see Methods).

Similar articles

Cited by

References

    1. Pfenninger KH. Plasma membrane expansion: a neuron's Herculean task. Nat Rev Neurosci. 2009;10:251–261. doi: 10.1038/nrn2593. - DOI - PubMed
    1. Bray D. Surface movements during the growth of single explanted neurons. Proc Natl Acad Sci USA. 1970;65:905–910. doi: 10.1073/pnas.65.4.905. - DOI - PMC - PubMed
    1. Craig AM, Wyborski RJ, Banker G. Preferential addition of newly synthesized membrane protein at axonal growth cones. Nature. 1995;375:592–594. doi: 10.1038/375592a0. - DOI - PubMed
    1. Dai J, Sheetz MP. Axon membrane flows from the growth cone to the cell body. Cell. 1995;83:693–701. doi: 10.1016/0092-8674(95)90182-5. - DOI - PubMed
    1. Popov S, Brown A, Poo MM. Forward plasma membrane flow in growing nerve processes. Science. 1993;259:244–246. doi: 10.1126/science.7678471. - DOI - PubMed

Publication types

LinkOut - more resources