Protein and phosphoprotein levels in glioma and adenocarcinoma cell lines grown in normoxia and hypoxia in monolayer and three-dimensional cultures
- PMID: 22276931
- PMCID: PMC3317865
- DOI: 10.1186/1477-5956-10-5
Protein and phosphoprotein levels in glioma and adenocarcinoma cell lines grown in normoxia and hypoxia in monolayer and three-dimensional cultures
Abstract
Background: Three dimensional (3D) growths of cancer cells in vitro are more reflective of in situ cancer cell growth than growth in monolayer (2D). The present study is designed to determine changes in protein and phosphoprotein that reflect adaptation of tumor cells to 3D as compared to 2D. Since relative hypoxia is a common feature of most solid tumors, the present study also aims to look at the impact of transition from normoxia to hypoxia in these two growth conditions.
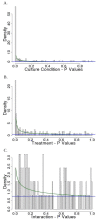
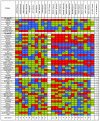
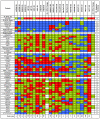
Results: Using reverse-phase protein arrays, we compared levels of 121 different phosphorylated and non-phosphorylated proteins in 5 glioma and 6 adenocarcinoma lines under conditions of 3D and monolayer culture in normoxia and hypoxia. A three-way analysis of variance showed levels of 82 antibodies differed between media (2D vs. 3D) and 49 differed between treatments (hypoxia vs. normoxia). Comparing 2D to 3D growth, 7 proteins were commonly (i.e., > 50% of tumors) elevated in 3D: FAK, AKT, Src, GSK3αβ, TSC2, p38, and NFκβp65. Conversely, 7 other proteins are commonly decreased: ATRIP, ATR, β-catenin, BCL-X, cyclin B1, Egr-1, and HIF-1α. Comparing normoxia to hypoxia, only NCKIPSD was commonly elevated in hypoxia; 6 proteins were decreased: cyclin B1, 4EBP1(Ser65), c-Myc, SMAD3(Ser423), S6(Ser235), and S6(Ser240). Hypoxia affected glioma cell lines differently from adenocarcinoma cell lines: 8 proteins were increased in gliomas (BAX, caspase 7, HIF-1α, c-JUN, MEK1, PARP 1 cleaved, Src, and VEGFR2) and none in adenocarcinomas.
Conclusions: We identified subsets of proteins with clearly concordant/discordant behavior between gliomas and adenocarcinomas. In general, monolayer to 3D culture differences are clearer than normoxia to hypoxia differences, with anti-apoptotic, cytoskeletal rearrangement and cell survival pathways emphasized in the former and mTOR pathway, transcription, cell-cycle arrest modulation, and increased cell motility in the latter.
Figures


Similar articles
-
Vasculogenesis and angiogenesis initiation under normoxic conditions through Wnt/β-catenin pathway in gliomas.Rev Neurosci. 2018 Jan 26;29(1):71-91. doi: 10.1515/revneuro-2017-0032. Rev Neurosci. 2018. PMID: 28822229 Review.
-
Inhibition of hypoxia inducible factor-1alpha (HIF-1alpha) decreases vascular endothelial growth factor (VEGF) secretion and tumor growth in malignant gliomas.J Neurooncol. 2006 Jul;78(3):233-47. doi: 10.1007/s11060-005-9103-z. Epub 2006 Apr 13. J Neurooncol. 2006. PMID: 16612574
-
[Effects of hypoxia inducible factor-1α on P311 and its influence on the migration of murine epidermal stem cells].Zhonghua Shao Shang Za Zhi. 2017 May 20;33(5):287-294. doi: 10.3760/cma.j.issn.1009-2587.2017.05.007. Zhonghua Shao Shang Za Zhi. 2017. PMID: 28651420 Chinese.
-
Silencing hypoxia-inducible factor-1alpha inhibits cell migration and invasion under hypoxic environment in malignant gliomas.Int J Oncol. 2007 Apr;30(4):793-802. Int J Oncol. 2007. PMID: 17332917
-
Hypoxia and the hypoxia-inducible-factor pathway in glioma growth and angiogenesis.Neuro Oncol. 2005 Apr;7(2):134-53. doi: 10.1215/S1152851704001115. Neuro Oncol. 2005. PMID: 15831232 Free PMC article. Review.
Cited by
-
3D culture broadly regulates tumor cell hypoxia response and angiogenesis via pro-inflammatory pathways.Biomaterials. 2015 Jul;55:110-8. doi: 10.1016/j.biomaterials.2015.03.035. Epub 2015 Apr 13. Biomaterials. 2015. PMID: 25934456 Free PMC article.
-
Three-dimensional microtissues essentially contribute to preclinical validations of therapeutic targets in breast cancer.Cancer Med. 2016 Apr;5(4):703-10. doi: 10.1002/cam4.630. Epub 2016 Jan 14. Cancer Med. 2016. PMID: 26763588 Free PMC article.
-
Gamma-enolase: a well-known tumour marker, with a less-known role in cancer.Radiol Oncol. 2015 Aug 21;49(3):217-26. doi: 10.1515/raon-2015-0035. eCollection 2015 Sep. Radiol Oncol. 2015. PMID: 26401126 Free PMC article. Review.
-
Prognostic role of METTL1 in glioma.Cancer Cell Int. 2021 Nov 27;21(1):633. doi: 10.1186/s12935-021-02346-4. Cancer Cell Int. 2021. PMID: 34838021 Free PMC article.
-
Multifunctional neuron-specific enolase: its role in lung diseases.Biosci Rep. 2019 Nov 29;39(11):BSR20192732. doi: 10.1042/BSR20192732. Biosci Rep. 2019. PMID: 31642468 Free PMC article. Review.
References
Grants and funding
LinkOut - more resources
Full Text Sources
Research Materials
Miscellaneous

