

Over-expression of leptin receptors in hypothalamic POMC neurons increases susceptibility to diet-induced obesity
- PMID: 22276206
- PMCID: PMC3262822
- DOI: 10.1371/journal.pone.0030485
Over-expression of leptin receptors in hypothalamic POMC neurons increases susceptibility to diet-induced obesity
Abstract
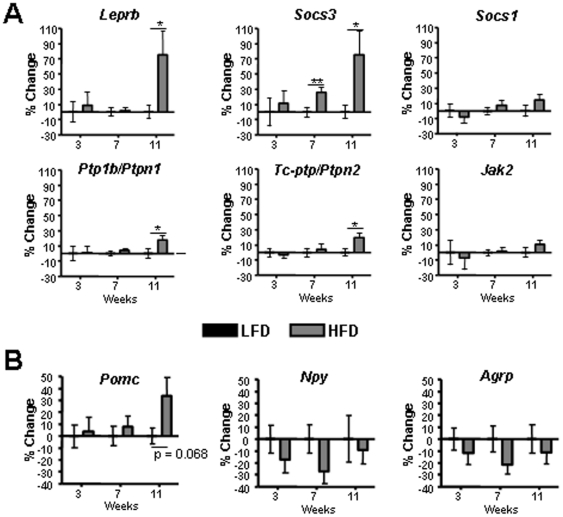
Diet-induced obesity (DIO) in rodents is characterized by impaired activation of signal-transducer and activator of transcription 3 (STAT3) by leptin receptors (LepRb) within the hypothalamic arcuate nucleus. This signaling defect likely plays an important role in development of DIO. However, the neuro-chemical identity of the leptin-STAT3 resistant arcuate neurons has not been determined and the underlying mechanisms responsible for development of cellular leptin resistance remain unclear. To investigate this, we first measured arcuate gene expression of known key signaling components of the LepRb signaling pathway and tested whether specifically the critical arcuate pro-opiomelanocortin (POMC) neurons are resistant to LepRb-STAT3 signaling in mice given a high-fat-diet (HFD) compared to mice provided a low-fat control diet (LFD). We found that leptin-dependent STAT3 phosphorylation was decreased within POMC neurons of HFD mice. In addition, Leprb mRNA and suppressor of cytokine signaling 3 (Socs3) mRNA were elevated in the arcuate of HFD mice. To investigate whether increased LepRb expression per se in POMC neurons can influence development of DIO and Socs3 expression, we created mice that over-express LepRb selectively in POMC neurons (POMC-LepRb). No differences in body weight, fat mass or food intake were found between LFD POMC-LepRb mice and LFD controls. Surprisingly, body weight, fat mass and caloric intake of HFD POMC-LepRb mice was markedly higher than HFD control mice. In addition, arcuate Socs3 mRNA was increased in HFD POMC-LepRb mice compared to HFD controls. These data show that specifically POMC neurons of DIO mice are resistant to STAT3 activation by leptin, indicating that those cells might play a role in development of DIO. Furthermore, over-expression of LepRb selectively in POMC neurons increases susceptibility to the development of DIO. We propose a model where over-reactivity of the leptin-LepRb signaling system in arcuate neurons may play causal a role in development of diet-induced obesity.
Conflict of interest statement
Figures


Similar articles
-
Somato-dendritic localization and signaling by leptin receptors in hypothalamic POMC and AgRP neurons.PLoS One. 2013 Oct 29;8(10):e77622. doi: 10.1371/journal.pone.0077622. eCollection 2013. PLoS One. 2013. PMID: 24204898 Free PMC article.
-
Phosphodiesterase-3B-cAMP pathway of leptin signalling in the hypothalamus is impaired during the development of diet-induced obesity in FVB/N mice.J Neuroendocrinol. 2015 Apr;27(4):293-302. doi: 10.1111/jne.12266. J Neuroendocrinol. 2015. PMID: 25702569
-
Enhanced Stat3 activation in POMC neurons provokes negative feedback inhibition of leptin and insulin signaling in obesity.J Neurosci. 2009 Sep 16;29(37):11582-93. doi: 10.1523/JNEUROSCI.5712-08.2009. J Neurosci. 2009. PMID: 19759305 Free PMC article.
-
Leptin receptor signaling and the regulation of mammalian physiology.Int J Obes (Lond). 2008 Dec;32 Suppl 7(Suppl 7):S8-12. doi: 10.1038/ijo.2008.232. Int J Obes (Lond). 2008. PMID: 19136996 Free PMC article. Review.
-
Mechanistic insight into high-fat diet-induced metabolic inflammation in the arcuate nucleus of the hypothalamus.Biomed Pharmacother. 2021 Oct;142:112012. doi: 10.1016/j.biopha.2021.112012. Epub 2021 Aug 10. Biomed Pharmacother. 2021. PMID: 34388531 Review.
Cited by
-
Leptin Resistance and the Neuro-Adipose Connection.Front Endocrinol (Lausanne). 2017 Mar 6;8:45. doi: 10.3389/fendo.2017.00045. eCollection 2017. Front Endocrinol (Lausanne). 2017. PMID: 28321206 Free PMC article. No abstract available.
-
Dysregulation of protein degradation in the hippocampus is associated with impaired spatial memory during the development of obesity.Behav Brain Res. 2020 Sep 1;393:112787. doi: 10.1016/j.bbr.2020.112787. Epub 2020 Jun 27. Behav Brain Res. 2020. PMID: 32603798 Free PMC article.
-
Sequence analysis of bovine C/EBPδ gene and its adipogenic effects on fibroblasts.Mol Biol Rep. 2014 Jan;41(1):251-7. doi: 10.1007/s11033-013-2858-y. Epub 2013 Nov 9. Mol Biol Rep. 2014. PMID: 24213926
-
Neurosecretory Protein GL, a Hypothalamic Small Secretory Protein, Participates in Energy Homeostasis in Male Mice.Endocrinology. 2017 May 1;158(5):1120-1129. doi: 10.1210/en.2017-00064. Endocrinology. 2017. PMID: 28323972 Free PMC article.
-
Exome Sequencing of 21 Bardet-Biedl Syndrome (BBS) Genes to Identify Obesity Variants in 6,851 American Indians.Obesity (Silver Spring). 2021 Apr;29(4):748-754. doi: 10.1002/oby.23115. Epub 2021 Feb 22. Obesity (Silver Spring). 2021. PMID: 33616283 Free PMC article.
References
-
- Friedman JM. Obesity in the new millennium. Nature. 2000;404:632–634. - PubMed
-
- Munzberg H, Huo L, Nillni EA, Hollenberg AN, Bjørbæk C. Role of signal transducer and activator of transcription 3 in regulation of hypothalamic proopiomelanocortin gene expression by leptin. Endocrinology. 2003;144:2121–2131. - PubMed
-
- Satoh N, Ogawa Y, Katsuura G, Hayase M, Tsuji T, et al. The arcuate nucleus as a primary site of satiety effect of leptin in rats. Neurosci Lett. 1997;224:149–152. - PubMed
Publication types
MeSH terms
Substances
Grants and funding
LinkOut - more resources
Full Text Sources
Medical
Molecular Biology Databases
Miscellaneous
