

Unraveling the regulatory mechanisms underlying tissue-dependent genetic variation of gene expression
- PMID: 22275870
- PMCID: PMC3261927
- DOI: 10.1371/journal.pgen.1002431
Unraveling the regulatory mechanisms underlying tissue-dependent genetic variation of gene expression
Abstract
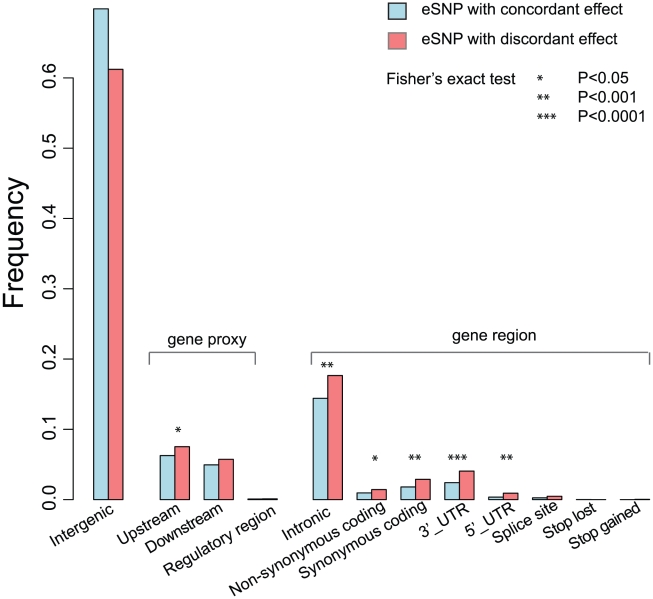
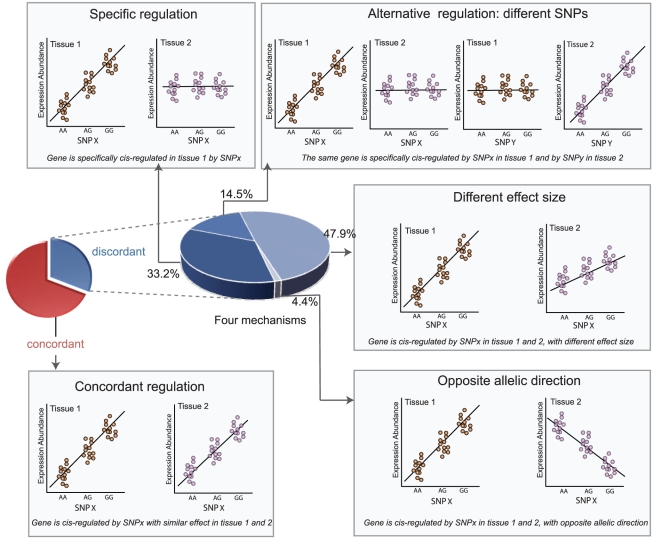
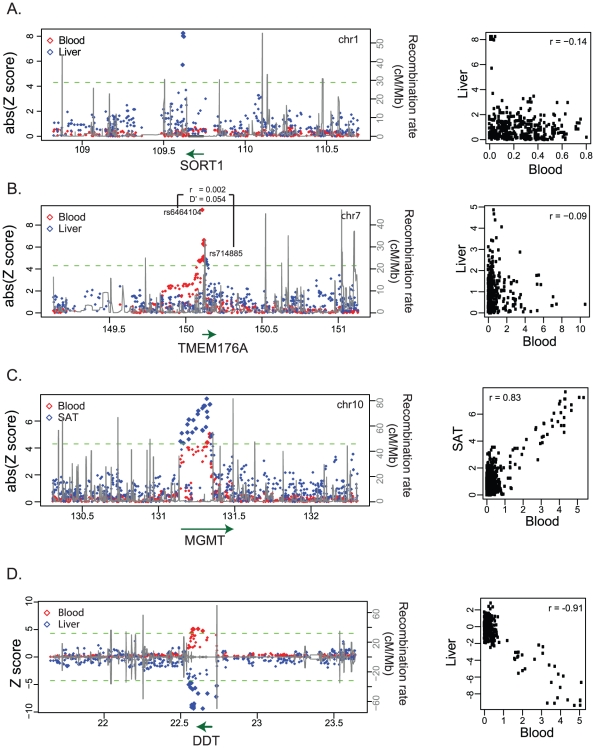
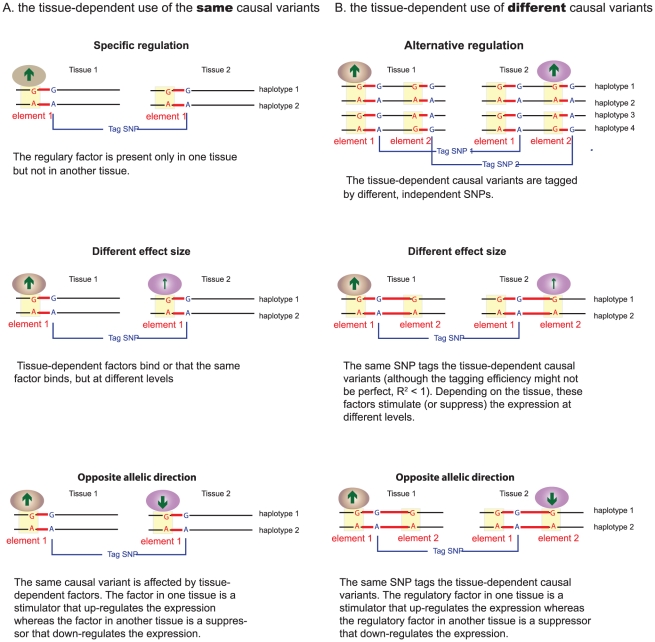
It is known that genetic variants can affect gene expression, but it is not yet completely clear through what mechanisms genetic variation mediate this expression. We therefore compared the cis-effect of single nucleotide polymorphisms (SNPs) on gene expression between blood samples from 1,240 human subjects and four primary non-blood tissues (liver, subcutaneous, and visceral adipose tissue and skeletal muscle) from 85 subjects. We characterized four different mechanisms for 2,072 probes that show tissue-dependent genetic regulation between blood and non-blood tissues: on average 33.2% only showed cis-regulation in non-blood tissues; 14.5% of the eQTL probes were regulated by different, independent SNPs depending on the tissue of investigation. 47.9% showed a different effect size although they were regulated by the same SNPs. Surprisingly, we observed that 4.4% were regulated by the same SNP but with opposite allelic direction. We show here that SNPs that are located in transcriptional regulatory elements are enriched for tissue-dependent regulation, including SNPs at 3' and 5' untranslated regions (P = 1.84×10(-5) and 4.7×10(-4), respectively) and SNPs that are synonymous-coding (P = 9.9×10(-4)). SNPs that are associated with complex traits more often exert a tissue-dependent effect on gene expression (P = 2.6×10(-10)). Our study yields new insights into the genetic basis of tissue-dependent expression and suggests that complex trait associated genetic variants have even more complex regulatory effects than previously anticipated.
Conflict of interest statement
The authors have declared that no competing interests exist.
Figures
Similar articles
-
Cis-regulatory variations: a study of SNPs around genes showing cis-linkage in segregating mouse populations.BMC Genomics. 2006 Sep 15;7:235. doi: 10.1186/1471-2164-7-235. BMC Genomics. 2006. PMID: 16978413 Free PMC article.
-
Powerful identification of cis-regulatory SNPs in human primary monocytes using allele-specific gene expression.PLoS One. 2012;7(12):e52260. doi: 10.1371/journal.pone.0052260. Epub 2012 Dec 26. PLoS One. 2012. PMID: 23300628 Free PMC article.
-
Trans-eQTLs reveal that independent genetic variants associated with a complex phenotype converge on intermediate genes, with a major role for the HLA.PLoS Genet. 2011 Aug;7(8):e1002197. doi: 10.1371/journal.pgen.1002197. Epub 2011 Aug 4. PLoS Genet. 2011. PMID: 21829388 Free PMC article.
-
Expression Quantitative Trait Loci Information Improves Predictive Modeling of Disease Relevance of Non-Coding Genetic Variation.PLoS One. 2015 Oct 16;10(10):e0140758. doi: 10.1371/journal.pone.0140758. eCollection 2015. PLoS One. 2015. PMID: 26474488 Free PMC article. Review.
-
Fishing for Function in the Human Gene Pool.Trends Genet. 2016 Jul;32(7):392-394. doi: 10.1016/j.tig.2016.05.002. Epub 2016 May 21. Trends Genet. 2016. PMID: 27220646 Free PMC article. Review.
Cited by
-
Extent, causes, and consequences of small RNA expression variation in human adipose tissue.PLoS Genet. 2012;8(5):e1002704. doi: 10.1371/journal.pgen.1002704. Epub 2012 May 10. PLoS Genet. 2012. PMID: 22589741 Free PMC article.
-
Genetical Genomics Reveals Large Scale Genotype-By-Environment Interactions in Arabidopsis thaliana.Front Genet. 2013 Jan 10;3:317. doi: 10.3389/fgene.2012.00317. eCollection 2012. Front Genet. 2013. PMID: 23335938 Free PMC article.
-
Determining the association between adipokine expression in multiple tissues and phenotypic features of non-alcoholic fatty liver disease in obesity.Nutr Diabetes. 2015 Feb 9;5(2):e146. doi: 10.1038/nutd.2014.43. Nutr Diabetes. 2015. PMID: 25664838 Free PMC article.
-
Genomic modulators of the immune response.Trends Genet. 2013 Feb;29(2):74-83. doi: 10.1016/j.tig.2012.10.006. Epub 2012 Nov 1. Trends Genet. 2013. PMID: 23122694 Free PMC article. Review.
-
HSPB1 Gene Variants and Schizophrenia: A Case-Control Study in a Polish Population.Dis Markers. 2022 Mar 15;2022:4933011. doi: 10.1155/2022/4933011. eCollection 2022. Dis Markers. 2022. PMID: 35340410 Free PMC article.
References
-
- Nicolae DL, Gamazon E, Zhang W, Duan S, Dolan ME, et al. Trait-associated SNPs are more likely to be eQTLs: annotation to enhance discovery from GWAS. PLoS Genet. 2010;6:e1000888. doi: 10.1371/journal.pgen.1000888. - DOI - PMC - PubMed
-
- Cheung VG, Conlin LK, Weber TM, Arcaro M, Jen K, et al. Natural variation in human gene expression assessed in lymphoblastoid cells. Nat Genet. 2003;33:422–425. - PubMed
Publication types
MeSH terms
Substances
Grants and funding
LinkOut - more resources
Full Text Sources
Other Literature Sources
Molecular Biology Databases
