. 2012 Apr 27;287(18):15001-15.
doi: 10.1074/jbc.M111.284034. Epub 2012 Jan 23.

ETS-1 protein regulates vascular endothelial growth factor-induced matrix metalloproteinase-9 and matrix metalloproteinase-13 expression in human ovarian carcinoma cell line SKOV-3

Affiliations

ETS-1 protein regulates vascular endothelial growth factor-induced matrix metalloproteinase-9 and matrix metalloproteinase-13 expression in human ovarian carcinoma cell line SKOV-3

Sonali Ghosh et al. J Biol Chem. .

Retraction in

Abstract

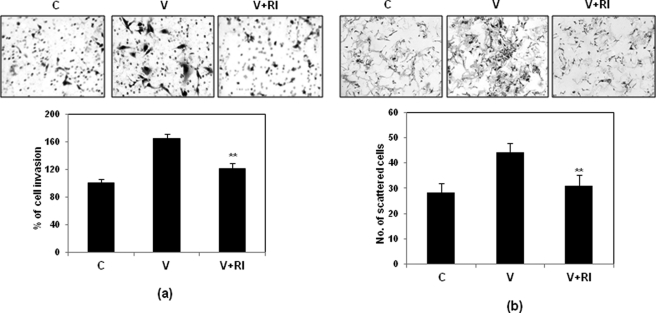
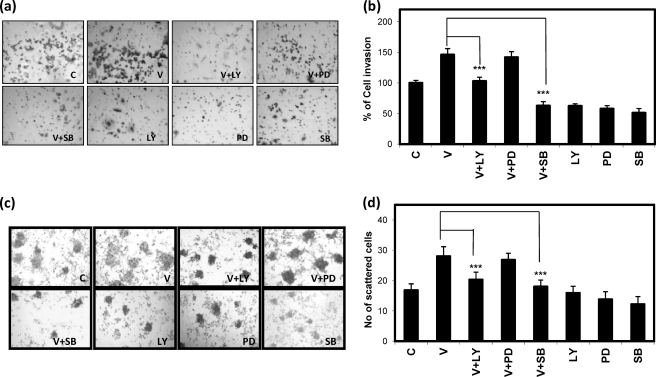
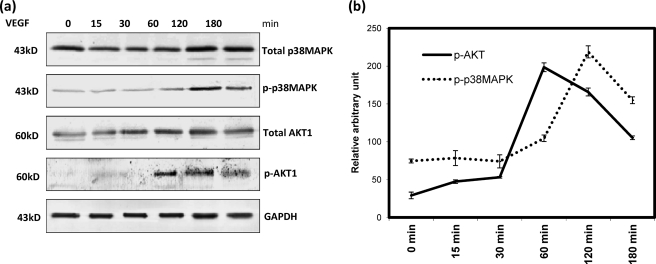
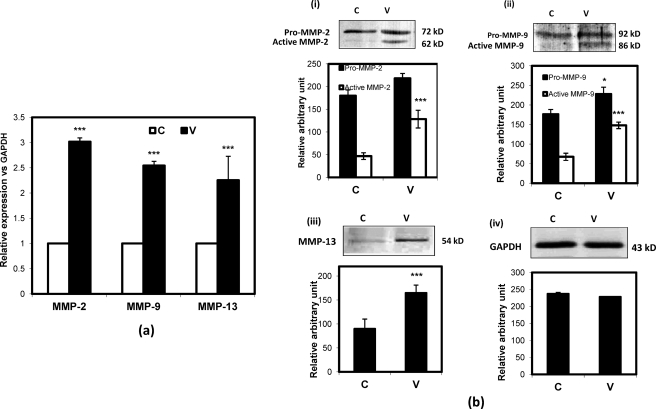
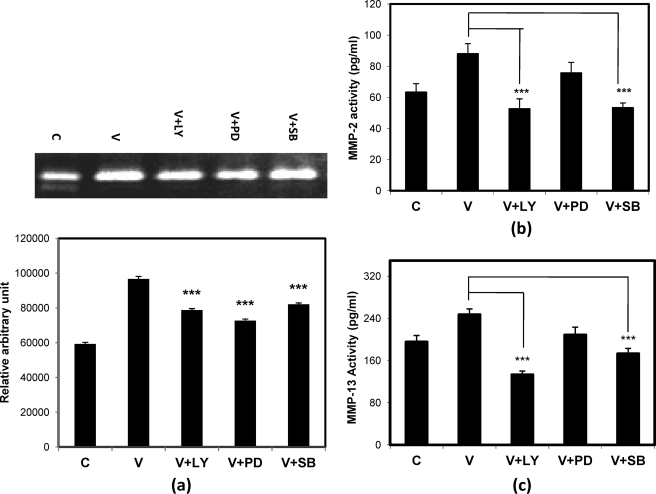
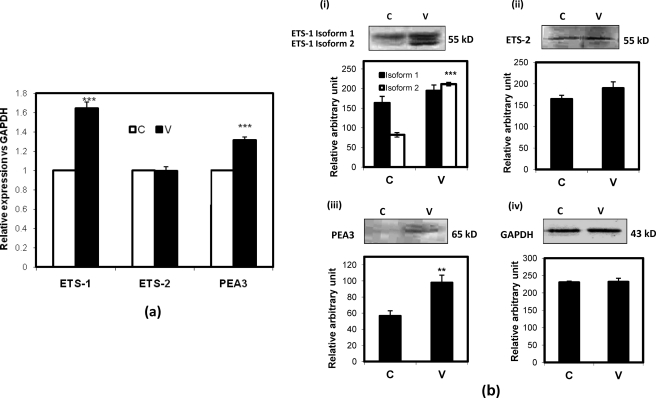
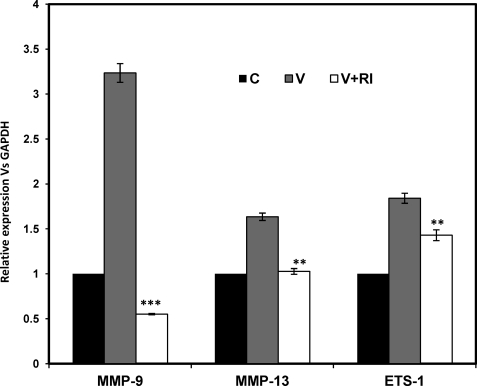
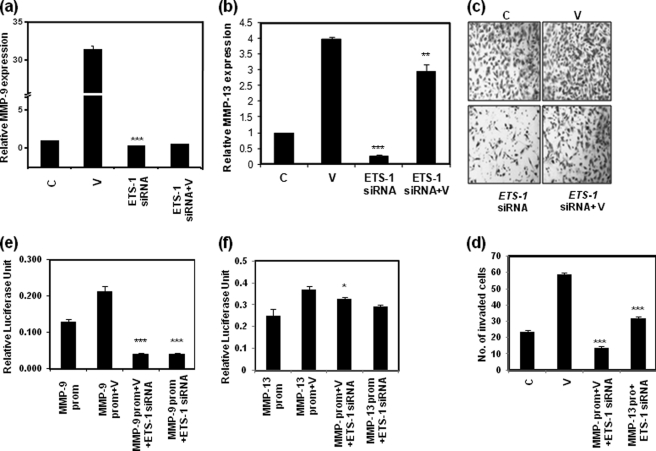
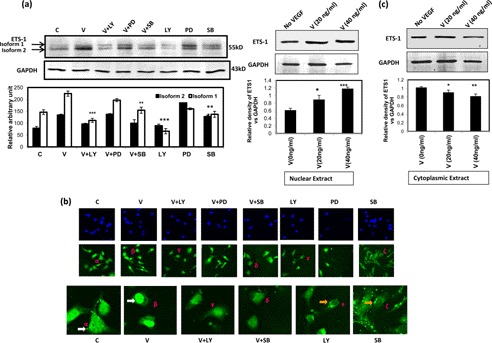
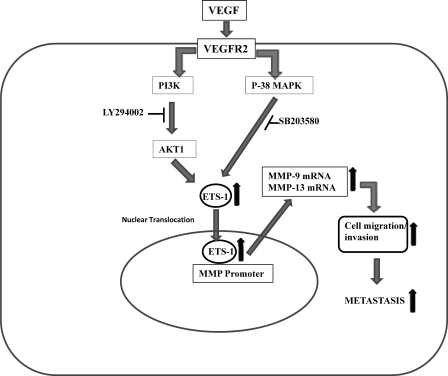
Matrix metalloproteinase-mediated degradation of extracellular matrix is a crucial event for invasion and metastasis of malignant cells. The expressions of matrix metalloproteinases (MMPs) are regulated by different cytokines and growth factors. VEGF, a potent angiogenic cytokine, induces invasion of ovarian cancer cells through activation of MMPs. Here, we demonstrate that invasion and scattering in SKOV-3 cells were induced by VEGF through the activation of p38 MAPK and PI3K/AKT pathways. VEGF induced the expression of MMP-2, MMP-9, and MMP-13 and hence regulated the metastasis of SKOV-3 ovarian cancer cells, and the activities of these MMPs were reduced after inhibition of PI3K/AKT and p38 MAPK pathways. Interestingly, VEGF induced expression of ETS-1 factor, an important trans-regulator of different MMP genes. ETS-1 bound to both MMP-9 and MMP-13 promoters. Furthermore, VEGF acted through its receptor to perform the said functions. In addition, VEGF-induced MMP-9 and MMP-13 expression and in vitro cell invasion were significantly reduced after knockdown of ETS-1 gene. Again, VEGF-induced MMP-9 and MMP-13 promoter activities were down-regulated in ETS-1 siRNA-transfected cells. VEGF enriched ETS-1 in the nuclear fraction in a dose-dependent manner. VEGF-induced expression of ETS-1 and its nuclear localization were blocked by specific inhibitors of the PI3K and p38 MAPK pathways. Therefore, based on these observations, it is hypothesized that the activation of PI3K/AKT and p38 MAPK by VEGF results in ETS-1 gene expression, which activates MMP-9 and MMP-13, leading to the invasion and scattering of SKOV-3 cells. The study provides a mechanistic insight into the prometastatic functions of VEGF-induced expression of relevant MMPs.


Figures

FIGURE 1.
FIGURE 1.
Effect of VEGF on invasion and scattering of SKOV-3 cells. The cells were treated with VEGF (V) alone or in combination with its inhibitor (V+RI) as indicated and assayed for their ability to migrate through Matrigel (a) or to scatter (b) compared with that of control (C). In the lower panel, the percentage of invaded or scattered cells in all three sets has been shown as a bar diagram. The experiments were performed three times, and the mean values ± S.D. (error bars) have been shown in the lower panels (***, p < 0.001 versus untreated control cells).
FIGURE 2.
FIGURE 2.
VEGF-induced cell invasion and scattering through PI3K/AKT and p38 MAPK pathways. The SKOV-3 cells were treated with VEGF (V) alone or in combination with LY, PD, or SB followed by Matrigel invasion and scattering assays. In a and c, microscopic views of invaded and scattered cells are shown, respectively, whereas their respective percent value (in the case of invasion) and number (in the case of scattering) with respect to control (C) are shown as bars in b and d, respectively. The invaded cells and the scattered colonies were scored, and the respective bar graph summarizes the mean ± S.D. (error bars) for the independent experiments (***, p < 0.001 versus untreated control cells).
FIGURE 3.
FIGURE 3.
To show time-dependent activation of phosphorylated and total forms of p38 MAPK and AKT1 by VEGF, cells were treated with VEGF for different length of times as indicated. The cellular proteins were extracted followed by immunodetection with the antibodies that can detect phosphorylated and total forms of p38 MAPK and AKT1, respectively (a). In each panel of bands, the molecular size markers and the name of the proteins are noted. The densitometric scanning of each band was performed using ImageJ software. The relative intensities of phosphorylated (p-) and total forms of p38 MAPK and AKT1 were calculated and plotted in the graph (b). These values were calculated on the basis of the mean of three independent experiments. C and V represent control and VEGF-treated cells, respectively. The expression of GAPDH was used as an internal loading control.
FIGURE 4.
FIGURE 4.
VEGF regulates expression of MMP-2, MMP-9, and MMP-13. The SKOV-3 cells were treated with VEGF followed by isolation of RNA and Q-PCR with MMP-2, MMP-9, and MMP-13 gene-specific primers (a). The relative expression of each gene has been shown with respect to GAPDH, and the -fold changes are represented as a bar diagram. The cellular proteins were isolated, electrophoresed, transferred onto a PVDF membrane, and immunodetected with antibodies for MMP-2 (b, panel i), MMP-9 (b, panel ii), and MMP-13 (b, panel iii), respectively. The molecular sizes of pro- and active forms of MMP-2 and MMP-9 are shown in b, panel i, and b, panel ii, respectively. The GAPDH expression (b, panel iv) was used as an internal loading control. The intensity of each band was calculated by ImageJ software and the mean ± S.D. (error bar) is represented as a bar. (*, p < 0.05; ***, p < 0.001 versus untreated control cells). C and V represent control and VEGF-treated cells, respectively.
FIGURE 5.
FIGURE 5.
Activities of MMP-2, MMP-9, and MMP-13 in presence of VEGF and inhibitors of different pathways. The gelatin zymography data show the VEGF-induced activity of MMP-9 (a). Here the cells were treated with VEGF alone or with LY, PD, or SB, and the cell supernatants were collected, processed, and subjected to gelatin zymography. The activity in terms of band intensity was measured by ImageJ software and is represented as a bar diagram below each band. The activities of MMP-2 (b) and MMP-13 (c) were shown by means of ELISA, and the colorimetric values have been represented as bars in each figure. Here the cell supernatants were processed and subjected to ELISA as described under “Materials and Methods.” For all panels, data are represented as mean ± S.D. (error bars) (***, p < 0.001 versus untreated control cells). C and V represent control and VEGF-treated cells, respectively.
FIGURE 6.
FIGURE 6.
VEGF-regulated expression profile of ETS-1, ETS-2, and PEA3 expression. SKOV-3 cells were treated with or without VEGF, and RNAs isolated from these cells were subjected to Q-PCR with primers for ETS-1, ETS-2, and PEA3. The relative expression of each gene is shown with respect to GAPDH, and the -fold changes are represented as bars (a). Total proteins were isolated from the cells as described above and immunodetected to check ETS-1 (b, panel i), ETS-2 (b, panel ii), and PEA3 (b, panel iii) protein expression using specific antibodies. The intensity of each band was calculated by ImageJ software and the mean ± S.D. (error bar) is represented as a bar. Molecular sizes of each band are noted. Here GAPDH expression has been uses as an internal loading control (b, panel iv). (**, p < 0.01 and p < 0.001 versus untreated control cells). C and V represent control and VEGF-treated cells, respectively.
FIGURE 7.
FIGURE 7.
Effect of RI on VEGF-induced expression of relevant genes (MMP-9, MMP-13, and ETS-1) in SKOV-3 cells. The cells were treated with VEGF (V; 20 ng/ml for 24 h) alone and in combination with RI followed by isolation of RNA. Q-PCR was performed with these RNAs using MMP-9, MMP-13, and ETS-1 gene-specific primers. The relative expression of each gene has been shown with respect to GAPDH, and the -fold changes are represented as bars. The experiment was performed three times, and the mean values ± S.D. (error bars) have been shown in the lower panels. (***, p < 0.001; **, p < 0.01 versus VEGF-induced cells as shown by bars). C, control cells.
FIGURE 8.
FIGURE 8.
VEGF-induced MMP-9 and MMP-13 expression and cell invasion (c and d) in SKOV-3 cells are shown. The cells were treated with VEGF alone (V), VEGF plus ETS-1 siRNA, or ETS-1 siRNA alone followed by RNA isolation and Q-PCR analysis with MMP-9 (a) and MMP-13 (b) gene-specific primers. Here the relative expression of MMP genes versus GAPDH is shown. The cells show significantly higher invasion with VEGF treatment (V) as measured by a Matrigel invasion assay (c) compared with control (C), and the induction was significantly reduced after ETS-1 siRNA treatment. The cell numbers are shown as bars in d (for a–d, **, p < 0.01; ***, p < 0.001 versus untreated control cells). To show the role of ETS-1 in the activation of MMP-9 (e) and MMP-13 (f) promoters, a luciferase reporter assay was performed. Here the SKOV-3 cells were transfected with the pGL3 vectors containing the specific promoters. These cells were treated with either VEGF (V), ETS-1 siRNA, or a combination of the two, and a luciferase assay was performed with the cell lysates. Here the VEGF-induced luciferase activities were significantly reduced with ETS-1 siRNA treatment. ETS-1 siRNA alone also reduced activation of the MMP-9 promoter but not the MMP-13 promoter in the cells without VEGF treatment. The data are represented as the mean of three independent experiments ±S.D. (error bars) (*, p < 0.05; ***, p < 0.001 versus only MMP-9 or MMP-13 promoter-containing vector-transfected cells). prom, promoter.
FIGURE 9.
FIGURE 9.
Induction of ETS-1 by VEGF through activation of PI3K/AKT and p38 MAPK pathways. The cells were treated with VEGF (V) alone or in combination with LY, PD, or SB. In another set, LY, PD, and SB were added independently as described under “Materials and Methods.” The cells were either subjected to Western immunoblot (a and c) or immunofluorescence microscopy (b). In Western immunodetection of ETS-1, its two isoforms were differentially expressed in the presence of the inhibitors as described. The intensities of each band were measured by ImageJ software and are shown as bars. Here, GAPDH expression is shown as a loading control (a). For immunofluorescence microscopy, the cells were treated with anti-ETS-1 antibody followed by Alexa Fluor 488-conjugated secondary antibody that shows green fluorescence where ETS-1 localizes (b, middle panel). In the upper panel, the cells were treated with the DNA-specific dye DAPI to localize the nucleus. In the lowest panel, some of the treated cells are presented at higher magnification to show the localization of ETS-1. The treatment condition of the cells is noted above the top panel. Here the symbols α, β, γ, δ, ϵ, and ζ are used in some cells in the middle and lower panels to indicate the magnified view of particular cells, for e.g. the α in the middle panel is magnified and shown as α in the lower panel and so on. The role of VEGF in the induction and accumulation of ETS-1 in the nucleus and cytoplasm is shown (c). The cells were treated with VEGF (0, 20, and 40 ng/ml) for 4 h, and the nuclear and cytoplasmic proteins were isolated followed by SDS-PAGE and Western immunodetection with ETS-1 antibody. The relative expression of ETS-1 versus GAPDH expression has been represented in the lower panels as bars. For a and c, the data are represented as the mean of three independent experiments ±S.D. (error bars) (*, p < 0.05; **, p < 0.01; ***, p < 0.001 versus untreated control cells (C)).
FIGURE 10.
FIGURE 10.
Hypothetical model showing VEGF-regulated MMP-9 and MMP-13 gene expression through ETS-1 following activation of PI3K/AKT and p38 MAPK pathways. Through its receptor on the SKOV-3 cell membrane, VEGF activates the PI3K/AKT and p38 MAPK pathways and recruits ETS-1 to the promoters of MMP-9 and MMP-13 to induce these genes. These MMPs in turn promote cell migration and invasion followed by metastasis. The upward arrow indicates up-regulation of genes.

Similar articles

Cited by

References

    1. Yap T. A., Carden C. P., Kaye S. B. (2009) Beyond chemotherapy: targeted therapies in ovarian cancer. Nat. Rev. Cancer 9, 167–181 - PubMed
    1. Bérubé M., Deschambeault A., Boucher M., Germain L., Petitclerc E., Guérin S. L. (2005) MMP-2 expression in uveal melanoma: differential activation status dictated by the cellular environment. Mol. Vis. 11, 1101–1111 - PubMed
    1. Sato T., Sakai T., Noguchi Y., Takita M., Hirakawa S., Ito A. (2004) Tumor-stromal cell contact promotes invasion of human uterine cervical carcinoma cells by augmenting the expression and activation of stromal matrix metalloproteinases. Gynecol. Oncol. 92, 47–56 - PubMed
    1. Di Nezza L. A., Misajon A., Zhang J., Jobling T., Quinn M. A., Ostör A. G., Nie G., Lopata A., Salamonsen L. A. (2002) Presence of active gelatinases in endometrial carcinoma and correlation of matrix metalloproteinase expression with increasing tumor grade and invasion. Cancer 94, 1466–1475 - PubMed
    1. Liotta L. A., Tryggvason K., Garbisa S., Hart I., Foltz C. M., Shafie S. (1980) Metastatic potential correlates with enzymatic degradation of basement membrane collagen. Nature 284, 67–68 - PubMed

Publication types

MeSH terms

Substances