Natural killer T cells suppress zymosan A-mediated granuloma formation in the liver by modulating interferon-γ and interleukin-10
- PMID: 22268994
- PMCID: PMC3372760
- DOI: 10.1111/j.1365-2567.2012.03562.x
Natural killer T cells suppress zymosan A-mediated granuloma formation in the liver by modulating interferon-γ and interleukin-10
Abstract
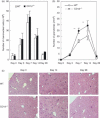
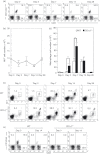
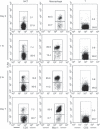
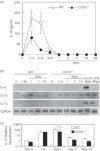
Wild-type (WT) and CD1d(-/-) [without natural killer (NK) T cells] mice were treated with zymosan A to induce granuloma formation in the liver. Increased granuloma formation was seen in NKT-less mice on days 7 and 14 after administration. WT mice showed limited granuloma formation, and zymosan A eventually induced NKT cell accumulation as identified by their surface marker (e.g. CD1d-tetramer). Zymosan A augmented the expression of Toll-like receptor 2 on the cell surface of both macrophages and NKT cells. One possible reason for accelerated granuloma formation in NKT-less mice was increased production of interferon- γ (IFN-γ); a theory that was confirmed using IFN-γ(-/-) mice. Also, zymosan A increased interleukin-10 production in WT mice, which suppresses IFN-γ production. Taken together, these results suggest that NKT cells in the liver have the potential to suppress zymosan A-mediated granuloma formation.
© 2012 The Authors. Immunology © 2012 Blackwell Publishing Ltd.
Figures


Similar articles
-
Differential modulating effect of natural killer (NK) T cells on interferon-γ production and cytotoxic function of NK cells and its relationship with NK subsets in Chlamydia muridarum infection.Immunology. 2011 Oct;134(2):172-84. doi: 10.1111/j.1365-2567.2011.03477.x. Immunology. 2011. PMID: 21896012 Free PMC article.
-
CD1d-restricted IFN-γ-secreting NKT cells promote immune complex-induced acute lung injury by regulating macrophage-inflammatory protein-1α production and activation of macrophages and dendritic cells.J Immunol. 2011 Feb 1;186(3):1432-41. doi: 10.4049/jimmunol.1003140. Epub 2010 Dec 29. J Immunol. 2011. PMID: 21191075
-
Defining a novel subset of CD1d-dependent type II natural killer T cells using natural killer cell-associated markers.Scand J Immunol. 2019 Sep;90(3):e12794. doi: 10.1111/sji.12794. Epub 2019 Jun 26. Scand J Immunol. 2019. PMID: 31141185 Free PMC article.
-
Natural killer T cells within the liver: conductors of the hepatic immune orchestra.Dig Dis. 2010;28(1):7-13. doi: 10.1159/000282059. Epub 2010 May 7. Dig Dis. 2010. PMID: 20460885 Review.
-
The Role of Adaptor Proteins in the Biology of Natural Killer T (NKT) Cells.Front Immunol. 2019 Jun 25;10:1449. doi: 10.3389/fimmu.2019.01449. eCollection 2019. Front Immunol. 2019. PMID: 31293596 Free PMC article. Review.
Cited by
-
Immunomodulation of Fungal β-Glucan in Host Defense Signaling by Dectin-1.Biomol Ther (Seoul). 2012 Sep;20(5):433-45. doi: 10.4062/biomolther.2012.20.5.433. Biomol Ther (Seoul). 2012. PMID: 24009832 Free PMC article. Review.
-
Repeated Stimulation of Toll-Like Receptor 2 and Dectin-1 Induces Chronic Pancreatitis in Mice Through the Participation of Acquired Immunity.Dig Dis Sci. 2022 Aug;67(8):3783-3796. doi: 10.1007/s10620-021-07186-w. Epub 2021 Aug 23. Dig Dis Sci. 2022. PMID: 34424458
-
The alteration of lymphocyte subsets in idiopathic granulomatous mastitis.Turk J Med Sci. 2021 Aug 30;51(4):1905-1911. doi: 10.3906/sag-2012-192. Turk J Med Sci. 2021. PMID: 33862673 Free PMC article.
-
Immune regulation: a new strategy for traditional Chinese medicine-based treatment of granulomatous lobular mastitis.Front Immunol. 2024 Oct 31;15:1494155. doi: 10.3389/fimmu.2024.1494155. eCollection 2024. Front Immunol. 2024. PMID: 39544943 Free PMC article. Review.
-
Immune pathogenesis of idiopathic granulomatous mastitis: from etiology toward therapeutic approaches.Front Immunol. 2024 Mar 11;15:1295759. doi: 10.3389/fimmu.2024.1295759. eCollection 2024. Front Immunol. 2024. PMID: 38529282 Free PMC article. Review.
References
-
- Bendelac A. Mouse NK1+ T cells. Curr Opin Immunol. 1995;7:367–74. - PubMed
-
- Bix M, Locksley RM. Natural T cells: cells that co-express NKRP-1 and TCR. J Immunol. 1995;155:1020–2. - PubMed
-
- Vicari AP, Zlotnik A. Mouse NK1.1+ T cells: a new family of T cells. Immunol Today. 1996;17:71–6. - PubMed
-
- Abo T, Kawamura T, Watanabe H. Physiological responses of extrathymic T cells in the liver. Immunol Rev. 2000;174:135–49. - PubMed
Publication types
MeSH terms
Substances
LinkOut - more resources
Full Text Sources
Molecular Biology Databases

