. 2012 Jan 17;21(1):105-20.
doi: 10.1016/j.ccr.2011.12.006.

KrasG12D-induced IKK2/β/NF-κB activation by IL-1α and p62 feedforward loops is required for development of pancreatic ductal adenocarcinoma

Affiliations

KrasG12D-induced IKK2/β/NF-κB activation by IL-1α and p62 feedforward loops is required for development of pancreatic ductal adenocarcinoma

Jianhua Ling et al. Cancer Cell. .

Abstract

Constitutive Kras and NF-κB activation is identified as signature alterations in pancreatic ductal adenocarcinoma (PDAC). However, how NF-κB is activated in PDAC is not yet understood. Here, we report that pancreas-targeted IKK2/β inactivation inhibited NF-κB activation and PDAC development in Kras(G12D) and Kras(G12D);Ink4a/Arf(F/F) mice, demonstrating a mechanistic link between IKK2/β and Kras(G12D) in PDAC inception. Our findings reveal that Kras(G12D)-activated AP-1 induces IL-1α, which, in turn, activates NF-κB and its target genes IL-1α and p62, to initiate IL-1α/p62 feedforward loops for inducing and sustaining NF-κB activity. Furthermore, IL-1α overexpression correlates with Kras mutation, NF-κB activity, and poor survival in PDAC patients. Therefore, our findings demonstrate the mechanism by which IKK2/β/NF-κB is activated by Kras(G12D) through dual feedforward loops of IL-1α/p62.


Figures

Figure 1
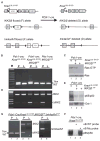
Figure 1. Generation of Mouse Strains with Pancreas-Specific KrasG12D Expression and Inactivation of IKK2/β with or without Parallel Deletion of Ink4a/Arf
(A) Graphic representation of the targeted KrasLSL-G12D, IKK2/β, and Ink4a/Arf alleles before and after Cre-mediated excision and recombination. (B) The presence of recombined KrasG12D allele in the pancreata (P) but not in the livers (L) of compound mutant mice was revealed by PCR. (C) Ras-GTP and total Ras levels in whole pancreatic protein extracts of 3-month-old Pdx1-Cre;KrasLSL-G12D, Pdx1-Cre;KrasLSL-G12D;IKK2/βF/F, and Pdx1-Cre; IKK2/βF/F mice. Elevated levels of Ras-GTP were observed only in compound mutant mice with Pdx1-Cre;KrasLSL-G12D alleles. (D) The recombined IKK2/βF/F allele was detected only in the pancreata (P), not in the livers (L), of mice carrying Pdx1-Cre;IKK2/βF/F alleles. (E) EMSA was performed to determine the levels of NF-κB DNA binding activity in the pancreata carrying Pdx1-Cre;KrasLSL-G12D, Pdx1-Cre;KrasLSL-G12D;IKK2/βF/F, or Pdx1-Cre;IKK2/βF/F alleles. Nuclear extracts from mouse pancreata were used in this analysis with a κB probe. Oct-1 probe was used as a loading control. (F) EMSA was performed with 32P-labeled κB probe in the presence and absence of both unlabeled wild-type (WT) and mutant (Mu) κB probes to determine the specificity of NF-κB DNA binding activity detected in the pancreata of Pdx1-Cre;KrasLSL-G12D mice as indicated. (G) Pancreas-specific deletion of Ink4a/Arf alleles was confirmed in Pdx1-Cre;KrasLSL-G12D;IKK2/βF/F;Ink4a/ArfF/F mice. The presence of the recombined KrasG12D allele and the exon 3-deleted IKK2/β allele in the pancreata (P) (lane 5) but not in the livers (L) (lane 6) of compound mutant mice was revealed by PCR.
Figure 2
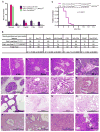
Figure 2. Suppression of Oncogenic KrasG12D-Induced Histological Progression of PanIN and PDAC with or without Concurrent Deletion of Ink4a/Arf by Inactivation of IKK2/β
(A) Numbers of mutant mice that developed PDAC, cystic ductal lesions (CDL), PanIN, or chronic pancreatitis (CP), or remained healthy, in cohorts of Pdx1-Cre;KrasLSL-G12D, Pdx1-Cre;KrasLSL-G12D;IKK2/βF/F, and Pdx1-Cre;IKK2/βF/F mice. (B) Chi-square analysis of the association between Pdx1-Cre;KrasLSL-G12D and Pdx1-Cre;KrasLSL-G12D;IKK2/βF/F, and the observed phenotypes in (A). Note: CP was found in PanIN, CDL, and PDAC; PanIN was coexisted with CDL and PDAC; and CDL was observed in PDAC. (C) Kaplan-Meier PDAC-free survival curve for Pdx1-Cre;KrasLSL-G12D;Ink4a/ArfF/F (n = 16) and Pdx1-Cre;KrasLSL-G12D;IKK2/βF/F;Ink4a/ArfF/F mice (n = 15). According to the approved animal protocol, mice that presented in a moribund state were killed for autopsy. (D–S) Representative pancreatic histologic views. (D) Normal pancreas from a wild-type mouse. (E) Histologic appearance of normal pancreas from a Pdx1-Cre;IKK2/βF/F mouse. (F) Histologic appearance of normal pancreas from a Pdx1-Cre;KrasLSL-G12D;IKK2/βF/F mouse. (G) A rare PanIN-1 from Pdx1-Cre;KrasLSL-G12D;IKK2/βF/F mouse. (H–O) Pdx1-Cre;KrasLSL-G12D mice. (H) Chronic pancreatitis (I) PanIN-1. (J) PanIN-2. (K) PanIN-3. (L) Cystic ductal lesion. (M) PDAC. (N) PDAC liver metastasis. (O) PDAC lung metastasis. (P-R) Pdx1-Cre;KrasLSL-G12D;Ink4a/ArfF/F mice. (P) PanIN. (Q) Cystic ductal lesion. (R) PDAC. (S) Histologic appearance of normal pancreas from a Pdx1-Cre;KrasLSL-G12D;Ink4a/ArfF/F;IKK2/βF/F mouse. See also Figure S1.
Figure 3
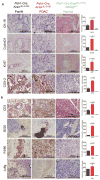
Figure 3
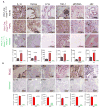
Comparison of the Cell Proliferation, Inflammation, and Immune Responses in the Pancreas between Pdx1-Cre;KrasLSL-G12D;IKK2/βF/F and Pdx1-Cre;KrasLSL-G12D Mice (A) Expression of CyclinD1, Ki-67, and COX-2 is elevated in PanIN and PDAC from Pdx1-Cre;KrasLSL-G12D mice, but not in the normal pancreas of Pdx1-Cre;KrasLSL-G12D;IKK2/βF/F mice. Positive immunostaining for Cytokeratin-19 (CK-19) verifies the ductal phenotype of PanIN lesions, PDAC, and normal duct. (B) Sections of formalin-fixed PanIN lesions and PDAC from 8-month old Pdx1-Cre;KrasLSL-G12D and normal duct tissue from Pdx1-Cre;KrasLSL-G12D;IKK2/βF/F mice underwent IHC staining with anti-CD3 antibody as a T cell marker, anti-B220 as a B cell marker, anti-F4/80 as a macrophage marker, and anti-Ly6g as a neutrophil marker. Error bars represent ± standard deviation (SD) from the data of five mice for each of the two genotypes.
Figure 4
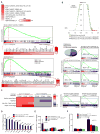
Figure 4. Gene Ontology and Gene Set Enrichment Analyses between Pancreata from Pdx1-Cre;KrasLSL-G12D and Pdx1-Cre;KrasLSL-G12D;IKK2/βF/F Mice and Profiling Cytokine Expression
(A) Enriched expression of NF-κB downstream target gene sets in Pdx1-Cre;KrasLSL-G12D;IKK2/βWT compared to Pdx1-Cre;KrasLSL-G12D;IKK2/βF/F. The heat map represents top enriched genes in Pdx1-Cre;KrasLSL-G12D;IKK2/βWT. NES, normalized enrichment score; NOM p value, nominal p value; FDR, false discovery rate q value. (red, high expression; blue, low expression). (B) GSEA analyses identify the enriched gene sets expressed either in Pdx1-Cre;KrasLSL-G12D;IKK2/βWT or Pdx1-Cre;KrasLSL-G12D;IKK2/βF/F using 198 KEGG pathway gene sets. One gene set are enrich in Pdx1-Cre;KrasLSL-G12D;IKK2/βWT and twenty seven gene sets are enriched in Pdx1-Cre;KrasLSL-G12D;IKK2/βF/F. Five NF-κB pathway-related gene sets are noteworthy enriched in Pdx1-Cre;KrasLSL-G12D; IKK2/βWT. Enriched gene sets were selected based on statistical significance (FDR q value < 0.25 and normalized p value < 0.05). (C) GSEA analyses of significant gene upregulation in Pdx1-Cre;KrasLSL-G12D revealed that they are strongly correlated to positive nodal status, high risk, higher tumor stage, and poor survival in PDAC patients by using 102 PDAC cDNA microarray data (GSE21501). Two- and 5-fold enriched expression in Pdx1-Cre;KrasLSL-G12D; IKK2/βF/F is correlated to low risk. ns, not significant (FDR q value > 0.25 and/or normalized p value > 0.05). (D) Analysis of differential cytokine gene expression between pancreatic cancer and normal pancreas (from 5- to 12-month-old Pdx1-Cre;KrasLSL-G12D mice and age-matched Pdx1-Cre;KrasLSL-G12D;IKK2/βF/F mice) by real-time PCR arrays. (E) Determination of IL-1α expression levels in pancreas, liver, and lung from Pdx1-Cre;KrasLSL-G12D, Pdx1-Cre;KrasLSL-G12D;IKK2/βF/F, Pdx1-Cre;IKK2/βF/F, and wild-type (WT) mice. (F) Evaluation of IL-1α and IL-1β expression levels in sera from Pdx1-Cre;KrasLSL-G12D, Pdx1-Cre;KrasLSL-G12D;IKK2/βF/F, Pdx1-Cre;IKK2/βF/F, and wild-type (WT) mice. Error bars represent ±SD of the data from three mice in each genotype as indicated. See also Figure S2 and Tables S1–S3.
Figure 5
Figure 5. Analysis of Signaling Pathways in PanIN, PDAC, and Histologically Normal Pancreas from Compound Mutant Mice and Human PDAC Patients
(A) Immunohistochemical analysis with anti-IL-1α, anti-Rantes (Chemokine [C-C motif] ligand 5), anti-c-Fos, anti-TAK1, anti-p62, and anti-p65 antibodies in sections of formalin-fixed PanIN lesions and PDAC from Pdx1-Cre;KrasLSL-G12D mice, and of normal duct tissues from Pdx1-Cre;KrasLSL-G12D;IKK2/βF/F mice. Error bars represent ±SD from the data of five mice for each of the three genotypes. (B) Immunohistochemical staining for IL-1α, TAK1, pAKT, c-Fos, p65, and p62 in sections of formalin-fixed human PDAC and adjacent histologically normal pancreatic tissues. Error bars represent ±SD from six human PDAC specimens.
Figure 6
Figure 6. Clinical Correlations among Mutant Kras, IL-α Overexpression, and NF-κB Activation in Human PDAC
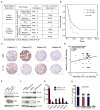
(A) The percentages of IL-1α positivity in PDAC tissues carrying a mutant Kras gene. Chi-square test was used to demonstrate the positive correlation between overexpression of IL-1α and the presence of a mutant Kras in PDAC tissues. (B) Kaplan-Meier survival analysis of PDAC patients with and without high levels of IL-1α expression using TMA. (C) Immunohistochemical staining for p65 and IL-1α in human PDAC tissue microarrays. Representative IHC stainings are shown, with four combinations of immunostaining patterns, E1: p65 high, IL-1α high; E2: p65 high, IL-1α low; E3: p65 low, IL-1α high; E4: p65 low, IL-1α low. (D) Scores of activated NF-κB are plotted against those of IL-1α overexpression. Spearman’s rank order correlation was used to demonstrate the positive correlation between NF-κB activity and expression levels of IL-1α in TMA. (E) Western blot analysis showing IL-1α and p62 overexpression in pancreatic cancer cell lines MDAPanc-28 and AsPc-1. (F) Western blot analysis of IL-1α and p62 expression in hTERT-immortalized human pancreatic ductal HPNE and HPDE cell lines. (G) Reporter gene assay for analyzing IL-1α promoter regulation by Kras, AP-1, and NF-κB pathways using mPDAC cells. (H) Reporter gene assay for analyzing the regulation of p62 promoter by AP-1 and NF-κB pathways using mPDAC cells. Error bars represent ±SD from three independent experiments. See also Figure S3.
Figure 7
Figure 7. Elucidation of Feedforward Signaling Pathways that Sustain Constitutive NF-κB Activation in Oncogenic KrasG12D-Induced PDAC
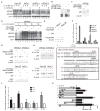
(A) Nuclear extracts of human PDAC cell lines MDAPanc-28 and AsPc-1 and mouse PDAC cell lines mPDAC-1 and mPDAC-2 (derived from Pdx1-Cre;KrasLSL-G12D), treated with anti-IL-1α neutralizing antibody (2 μg/ml) for 0, 4, or 8 hr or with anti-IL-1β neutralizing antibody (2 μg/ml) for 0 or 8 hr as indicated, were analyzed by EMSA to determine NF-κB activity using a probe containing an NF-κB DNA binding site. Oct-1 DNA binding activities were determined as loading controls. (B) EMSA was performed to determine the specificity of inducible RelA/p50 NF-κB DNA binding activity. Competition and supershift assays were performed using 20 μg of nuclear protein from mPDAC-2 cells as indicated. (C) Western blot was performed to determine the expression of p62 in mPDAC cells (CTL), mPDAC cells (p62-shRNA) expressing p62shRNA, and mPDAC cells (SB-shRNA) expressing scrambled control shRNA with anti-p62 antibody. Relative protein loading was determined by the use of anti-β-actin antibody. (D) NF-κB activities in the nuclear extracts of mPDAC cells (CTL), mPDAC cells (p62-shRNA) expressing p62shRNA, and mPDAC cells (SB-shRNA) expressing scrambled control shRNA stimulated with IL-1α for the times indicated were determined by EMSA. Oct-1 DNA binding activities were determined as loading controls in (A) and (D). (E) NF-κB-dependent expression of p62 was determined by western blot analysis in protein extracts from MDAPanc-28 and AsPc-1 cells expressing a Flag-tagged IκBα mutant (Flag-IκBαM) and their control cells expressing a puromycin resistance vector (CTL/Puro). Flag-IκBαM expression was verified by using anti-Flag antibody. Relative protein loading was determined by the use of anti-β-actin antibody. (F) IL-1α-regulated p62 expression was determined by real-time PCR in MDAPanc-28, AsPc-1, mPDAC-1, and mPDAC-2 treated with anti-IL-1α neutralizing antibody (2 μg/ml) for 8 hr or IL-1α (10 ng/ml) for 1 hr as indicated. (G) IKK2/β-induced p62 expression was determined by western blot analysis using MDAPanc-28, AsPc-1, mPDAC-1, and mPDAC-2 cells expressing IKK2/β-shRNA (IKK2-shRNA) and their control cells expressing a puromycin resistance vector (CTL/Puro) and scrambled shRNA (CTL-shRNA). IKK2/β expression was verified by using anti-IKK2/β antibody. Relative protein loading was determined by the use of anti-β-actin antibody. (H) IL-1α-regulated p62 expression was determined by western blot analysis in protein extracts of MDAPanc-28, AsPc-1, mPDAC-1, and mPDAC-2 cells treated with anti-IL-1α neutralizing antibody (2 μg/ml) for 8 hr or IL-1α (10 ng/ml) for 1 hr as indicated. Relative protein loading was determined by using anti-β-actin antibody. (I) The sequence alignment between mouse and human p62 promoter regions was presented with AP-1 and NF-κB binding sites indicated. (J) The activities of the AP-1 and κB binding sites in mouse p62 promoter were determined. mPDAC cells were stimulated with IL-1α for one hour and ChIP assays were performed with anti-c-Fos and anti-p65/NF-κB antibodies and IgG as negative control by using real-time PCR. (K) Analysis of p62 promoter activities in mPDAC-1 cells. The luciferase reporter gene activities are presented with the schematic illustration of the different luciferase reporter constructs of the p62 promoter constructs with mutated AP-1 and κB binding sites and control plasmids as indicated. Luciferase activity was measured as described in Experimental Procedures. Error bars represent ±SD from three independent experiments. See also Figure S4.
Figure 8
Figure 8. AP-1 Induced by Oncogenic KrasG12D Initiates Feedforward Loops of IL-1α and p62 to Induce and Sustain Constitutive NF-κB Activation and the Working Model
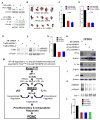
(A) Knocked down expression of IL-1α and p62 in mPDAC and LKP-13 cells. The expression levels of p62 and IL-1α in mPDAC and LKP-13 cells expressing scrambled shRNA (SBshRNA), p62shRNA, and IL-1αshRNA was determined using anti-p62 or anti- IL-1α antibody in western blot with β-actin as relative protein loading controls. (B) The resected orthotopic tumors attached to spleen in fifteen C57B6 mice injected with mPDAC-SBshRNA, mPDAC-p62shRNA, and mPDAC-IL-1αshRNA cells (n = 5 per group) were shown at week 5. S: spleen; T: tumor. (C) Tumor weight in C57B6 mice orthotopically injected with mPDAC-SBshRNA, mPDAC-p62shRNA, and mPDAC-IL-1αshRNA cells. Columns: mean of all individual tumors in each group. Error bars: ±SD of the pancreatic tumor from five mice in each of the three groups as indicated. (D) Percentage of C57B6 mice that developed subcutaneous tumors after injection of LKP-13-SB-shRNA, LKP-13-p62shRNA, and LKP-13-IL-1αshRNA cells. Columns: percentage of the mice that grew tumor in each group (n = 5). The statistical significance was determined by Fisher’s exact test. (E) Expression of TRAF6 in mPDAC cells expressing scrambled Traf6 shRNA (SB-shRNA) and two Traf6-shRNA (Traf6-shRNA-1 and 2) was determined by anti-TRAF6 antibody with β-actin as loading control. (F) NF-κB activities in the nuclear extracts of mPDAC cells expressing scrambled Traf6 shRNA (SB-shRNA) and two Traf6-shRNAs were determined by EMSA. Oct-1 DNA binding activities were determined as loading controls. (G) Quantitation of NFκB activities in EMSA by Image Analysis Software (ImageQuant TL 7.0). (H) c-Fos expression in mPDAC expressing a scrambled control shRNA (SB-shRNA) and three different cFos-shRNAs (cfos-shRNA-1, 2, 3) was determined with anti-cFos antibody in western blot analysis. (I) The levels of IL-1α in mPDAC cytoplasmic extracts expressing a scrambled control shRNA (SB-shRNA) and three different cFos-shRNAs (c-fos-shRNA-1, 2, 3) were analyzed by anti-IL-1α western blot with β-actin as loading control. (J) p62 expression in mPDAC cells expressing a scrambled control shRNA(SB-shRNA), and three different cFos-shRNAs (cfos-shRNA-1, 2, 3) were analyzed by anti-p62 western blot with β-actin as loading control. (K) NF-κB activity from mPDAC expressing a scrambled control shRNA(SB-shRNA) and three different cFos-shRNAs (cfos-shRNA-1, 2, 3) were analyzed by EMSA. Oct-1 DNA binding activities were determined as loading controls (L) Quantitation of NFκB activities in EMSA by Image Analysis Software (ImageQuant TL 7.0). (M) A proposed working model illustrates the potential mechanism through which KrasG12D oncogenic signaling induces feedforward loops of IL-1α and p62 to sustain constitutive IKK2/β/NF-κB activation in PDAC development. See also Figure S5.

Similar articles

Cited by

References

    1. Aguirre AJ, Bardeesy N, Sinha M, Lopez L, Tuveson DA, Horner J, Redston MS, DePinho RA. Activated Kras and Ink4a/Arf deficiency cooperate to produce metastatic pancreatic ductal adenocarcinoma. Genes Dev. 2003;17:3112–3126. - PMC - PubMed
    1. Barbie DA, Tamayo P, Boehm JS, Kim SY, Moody SE, Dunn IF, Schinzel AC, Sandy P, Meylan E, Scholl C, et al. Systematic RNA interference reveals that oncogenic KRAS-driven cancers require TBK1. Nature. 2009;462:108–112. - PMC - PubMed
    1. Bardeesy N, Aguirre AJ, Chu GC, Cheng KH, Lopez LV, Hezel AF, Feng B, Brennan C, Weissleder R, Mahmood U, et al. Both p16(Ink4a) and the p19(Arf)-p53 pathway constrain progression of pancreatic adenocarcinoma in the mouse. Proc Natl Acad Sci USA. 2006;103:5947–5952. - PMC - PubMed
    1. Basseères DS, Ebbs A, Levantini E, Baldwin AS. Requirement of the NF-kappaB subunit p65/RelA for K-Ras-induced lung tumorigenesis. Cancer Res. 2010;70:3537–3546. - PMC - PubMed
    1. Brentnall TA, Bronner MP, Byrd DR, Haggitt RC, Kimmey MB. Early diagnosis and treatment of pancreatic dysplasia in patients with a family history of pancreatic cancer. Ann Intern Med. 1999;131:247–255. - PubMed

Publication types

MeSH terms

Associated data