. 2012 Jan 11;32(2):658-73.
doi: 10.1523/JNEUROSCI.2927-11.2012.

Subsynaptic AMPA receptor distribution is acutely regulated by actin-driven reorganization of the postsynaptic density

Affiliations

Subsynaptic AMPA receptor distribution is acutely regulated by actin-driven reorganization of the postsynaptic density

Justin M Kerr et al. J Neurosci. .

Abstract

AMPA receptors (AMPARs) mediate synaptic transmission and plasticity during learning, development, and disease. Mechanisms determining subsynaptic receptor position are poorly understood but are key determinants of quantal size. We used a series of live-cell, high-resolution imaging approaches to measure protein organization within single postsynaptic densities in rat hippocampal neurons. By photobleaching receptors in synapse subdomains, we found that most AMPARs do not freely diffuse within the synapse, indicating they are embedded in a matrix that determines their subsynaptic position. However, time lapse analysis revealed that synaptic AMPARs are continuously repositioned in concert with plasticity of this scaffold matrix rather than simply by free diffusion. Using a fluorescence correlation analysis, we found that across the lateral extent of single PSDs, component proteins were differentially distributed, and this distribution was continually adjusted by actin treadmilling. The C-terminal PDZ ligand of GluA1 did not regulate its mobility or distribution in the synapse. However, glutamate receptor activation promoted subsynaptic mobility. Strikingly, subsynaptic immobility of both AMPARs and scaffold molecules remained essentially intact even after loss of actin filaments. We conclude that receptors are actively repositioned at the synapse by treadmilling of the actin cytoskeleton, an influence which is transmitted only indirectly to receptors via the pliable and surprisingly dynamic internal structure of the PSD.


Figures

Figure 1.
Figure 1.
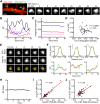
Synaptic AMPARs are confined to subsynaptic domains. A, Confocal image of cultured hippocampal neuron expressing PSD-95-mCh + SEP-GluA1. Scale bar, 10 μm. B, Experimental design for comparing partial and full synapse photobleaching to measure AMPAR intrasynaptic mobility. Fully photobleached synapses (top) will only recover fluorescent receptors via exchange of extrasynaptic receptors. Partially photobleached synapses (bottom) have an additional unbleached population of receptors that will speed recovery in the bleached subregion if they are mobile. C, D, Example synapses expressing SEP-GluA1 and PSD-95-mCh where all or part of the synaptic SEP-GluA1 was photobleached. Brackets represent the region targeted for photobleaching just before t = 0. Scale bar, 1 μm. E, F, SEP-GluA1 fluorescence recovery after either full or partial synapse photobleaching. Experiments were interleaved in neurons coexpressing either PSD-95-mCh or cytosolic mCh. n = 7–19 synapses from 7 to 9 neurons. G, SEP-GluA1 fluorescence recovery in synapses targeted for full or partial synapse photobleaching, and control synaptic regions at the indicated times following photobleaching. Number of synapses/neurons: At 10 s: full 34/9, partial 20/7. At 600 s: full 37/9, partial 10/4. Unbleached region of partially bleached synapses: 10/4. Control, unbleached synapses 10/4. n.s., p ≫ 0.05.
Figure 2.
Figure 2.
Morphology of AMPAR clusters is continuously dynamic and coordinated with morphology of the PSD. A, Confocal image of a region of dendrite (left) from a neuron expressing Membrane-mCh and both SEP-GluA1 and SEP-GluA2. Example synapse (right) is from the spine marked with an arrow. Scale bar, 1 μm. B, Receptor cluster EF (EF = length/breadth) for 4 example synapses imaged every 2 min for 60 min. C, SEP-GluA1,2 fluorescence intensity of the synapses in B. D, CV of EF and of integrated SEP-GluA1,2 fluorescence intensity for all imaged synapses on 1 neuron. The best linear fit to the data (black line) revealed no correlation (r2 = 0.0089, p = 0.25; n = 37 synapses). Group mean r2 = 0.0393, p = 0.11; n = 67 synapses, 4 neurons (data not shown). E, Time-lapse images of a synapse from a neuron expressing PSD-95-mCh and SEP-GluA1. Dashed lines represent regions used for intensity profiles in F. Scale bar, 1 μm. F, Line profiles measuring fluorescence intensity across three different axes from the synapse shown in E. Fluorescence normalized to peak intensity value in that dimension. Red, PSD-95-mCh; green, SEP-GluA1. G, EF over time for PSD (red) and AMPAR cluster (green) measured in three synapses. H, EF ratio (the quotient of PSD EF and receptor cluster EF) calculated at single synapses and averaged for each neuron (n = 4 neurons). I, EF of PSD and AMPAR cluster averaged over time (20 min) for each synapse in a neuron. Average EF values were strongly correlated (group mean r2 = 0.85, n = 4 neurons). J, CV of the EF of PSD and AMPAR cluster calculated for individual synapses (>20 min). The two measures also strongly correlated on a synapse-by-synapse basis (group mean r2 = 0.48, n = 4 cells).
Figure 3.
Figure 3.
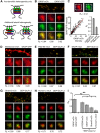
Subsynaptic AMPAR distribution patterns are diverse and differentially related to individual scaffold components. A, Model summarizing the known lamination of PSD proteins in the axo-dendritic axis (top) and two potential organizations of scaffold proteins that are in addition heterogeneous across the lateral extent of the synapse (bottom). B, Neuron expressing two different GKAP constructs, one tagged with mCh and the other with GFP. For each synapse, RF value shown was calculated as in C. Scale bars, 5 μm (top) and 1 μm (bottom), apply to all panels. C, Procedure for calculating the pixel-wise fluorescence correlation coefficient (RF). Dashed line on the images indicates the region in which correlation was calculated. Red line is the result of regression analysis to determine the best linear fit (bottom left graph). The bounds of RF measurements in this assay were empirically determined (bottom right graph) with interleaved measurements of synapses from neurons expressing GKAP-GFP and GKAP-mCh (upper bound) and GKAP-GFP:Membrane-mCh (lower bound). D, Neuron expressing membrane-mCh and GKAP-GFP. Insets show example spines with PSDs; the spines were generally as large as the cropped image, highlighting that membrane-mCherry is found in synapses but not targeted there specifically. E–H, Pairwise coexpression of the indicated scaffold components and SEP-GluA1,2. I, Mean RF for neurons expressing the indicated constructs. (n = 5, 7, 7, 7, 8 neurons in the order shown). Statistics: Kruskal–Wallis ANOVA (p ≪ 0.001) post hoc pairwise comparisons by Mann–Whitney U test, **p < 0.05.
Figure 4.
Figure 4.
GluA1 PDZ ligand deletion does not alter receptor positioning or mobility. A, B, Dendrite regions from neurons expressing either full-length SEP-GluA1 (A) or SEP-GluA1 1–880, lacking the PDZ ligand (B), and PSD-95-mCh. Scale bar, 10 μm. C, Mean RF for neurons expressing the indicated constructs. (n = 4, 9, 12, 6 neurons in the order shown). Statistics: Kruskal–Wallis ANOVA (p ≪ 0.001) post hoc pairwise comparisons by Mann–Whitney U test, *p < 0.05. D, E, SEP-GluA1 fluorescence recovery after either full or partial synapse photobleaching. Experiments were interleaved in neurons coexpressing either SEP-GluA1 or SEP-GluA1 1–880. n = 9–31 synapses from 5–10 neurons.
Figure 5.
Figure 5.
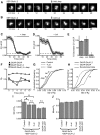
Actin acutely regulates synapse shape and subsynaptic AMPAR distribution. A, Confocal images of an AMPAR cluster (SEP-GluA1,2) over time. Arrow indicates application of 5 μm jasplakinolide. Scale bar, 1 μm. B, Confocal images of an AMPAR cluster (SEP-GluA1,2) over time. Arrow indicates application of 20 μm latrunculin. Scale bar, 1 μm. C, CV of AMPAR cluster EF analyzed in 10 min running bins. Jasplakinolide was added and remained in the bath as indicated by the thick black bar. The thin dashed bar indicates points before the time of drug application that are affected because the binned analysis includes some time points from after the application. Thin dashed line indicates CV of EF measured in fixed cells. n = 6 neurons. D, CV of AMPAR cluster EF analyzed in 10 min running bins. Latrunculin was added and remained in the bath as indicated by the bar. Bars as in C. n = 8 neurons. E, Percentage decrease in CV of EF between 5 and 15 min and 25–35 min bins. F, RF values over time at single synapses from neurons expressing GKAP-mCh + GKAP-GFP (triangle) or GKAP-mCh + SEP-GluA1,2 (square), or GKAP-mCh + SEP-GluA1,2 after application of jasplakinolide (circle). G, H, Cumulative frequency plots of the SD of RF calculated over 10 min (6 time points) at synapses in neurons treated as indicated. For jasplakinolide (5 μm) and latrunculin (20 μm) groups, the treatment was applied 5–10 min before image acquisition so that their effects were complete before t = 0. GKAP-mCh:SEP-GluA1,2: control n (synapses/neurons) = 137/19; jasp n = 73/9, lat n = 41/10, GKAP-mCh:GKAP-GFP n = 98/7. For G, p < 0.05 for latrunculin-treated (dot) compared with control (solid) and p < 0.01 for jasplakinolide-treated (dash) compared with control; for H, p ≪ 0.001 of randomized data compared with experimental data, Kolmogorov–Smirnov test. I, J, SD (I) or mean (J) RF for the groups in G and H. Kruskal–Wallis ANOVA (p ≪ 0.001) post hoc pairwise comparisons by Mann–Whitney U test *p < 0.05, n.s. p ≫ 0.05.
Figure 6.
Figure 6.
Synaptic AMPAR retention is primarily actin-independent. A, Region from a neuron expressing SEP-GluA1 and SEP-GluA2 along with the probe Lifeact-Ruby that binds F-actin. Latrunculin (20 μm) was applied just before the image stack was acquired for t = 0. Scale bar, 5 μm. B, Spine marked in A by arrowhead imaged at the indicated times. Scale bar, 1 μm. C, D, Normalized fluorescence intensity over time for a group of experiments performed with the indicated treatments of either 0.1% DMSO (C) or 20 μm latrunculin (D). Red traces are Lifeact-Ruby fluorescence measured in spines (circles) or dendrites (triangles). Green traces are SEP-GluA1 fluorescence measured in spines (circles) or dendrites (triangles). n = 8 lat, 6 DMSO. E, Normalized fluorescence intensity measurements for mCh-tagged PSD scaffold proteins or Lifeact-Ruby with 20 μm latrunculin treatment as indicated. Neurons were grown for either 14–17 DIV (left) or 7–10 DIV (right) before imaging. n = 6 neurons for PSD-95, 6 GKAP, 4 Homer, 3 Lifeact (DIV 14–17), and n = 5 PSD-95, 6 GKAP, 7 Shank, 5 Homer, 3 Lifeact (DIV 7–10). For DIV 7–10, p values Mann–Whitney U test comparing baseline to mean of the two values flanking 10 min were 0.83 PSD-95, 0.03 GKAP, 0.007 Shank, and 0.012 Homer.
Figure 7.
Figure 7.
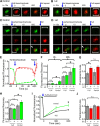
Subsynaptic AMPAR confinement persists even after actin filament depolymerization. A, B, Synapses from neurons expressing SEP-GluA1 and PSD-95-PATagRFP. After acquiring baseline images, a brief 405 nm laser pulse was applied to the full synapse to simultaneously bleach SEP-GluA1 fluorescence and activate PSD-95-PATagRFP fluorescence. A final bleach/activation step was applied to the full synapse after t = 600 s (large bracket). In B and D, neurons were treated with latrunculin (20 μm) for at least 5 min before and during imaging. Scale bar (in A), 500 nm, applies to A–D. C, D, Synapses from experiments conducted as in A and B, except that only a portion of the synapse was targeted (brackets). E, Quantification of normalized SEP-GluA1 (green) and PSD-95-PATagRFP (red) fluorescence over time, for synapses targeted for full photoactivation/photobleaching. Control (solid line, n = 27) or latrunculin treated (dashed line, n = 21). F, SEP-GluA1 fluorescence recovery measured at the indicated time points for either full or partial synapse photobleaching. Gray bars are from untreated neurons and green bars from latrunculin treated. Number of synapses/neurons: Full photobleaching: control 27/11, latrunculin 21/8, Partial photobleaching: control n = 10/6, latrunculin 12/6. *p < 0.05, n.s. not significant. G, PSD-95-PATagRFP fluorescence loss 600 s after photoactivation in either full or partial synapse targeting. Same synapses as in F. Gray bars are from untreated neurons and red bars from latrunculin-treated. *p < 0.05, n.s. not significant. H, SEP-GluA1 fluorescence recovery measured at 600 s for either full or partial synapse photobleaching in control conditions (gray) or with 5 min of 8 μm glutamate application (green). Full photobleaching: control n = 25/15, glutamate 31/12. Partial photobleaching: control 16/10, glutamate 15/7. Kruskal–Wallis ANOVA (p ≪ 0.001) post hoc pairwise comparisons by Mann–Whitney U test *p = 0.001, n.s. not significant. I, SEP-GluA1 fluorescence recovery measured at the indicated time points after full synapse photobleaching in control conditions (black) or with 5 min of 8 μm glutamate application (green). *p = 0.001, as in H. J, PSD-95-PATagRFP fluorescence loss 10 min after photoactivation for full or partial synapse targeting as indicated; gray bars, control, and red bars, glutamate treated. Kruskal–Wallis ANOVA n.s. not significant p = 0.44.
Figure 8.
Figure 8.
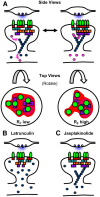
Potential mechanism of actin-regulated AMPAR subsynaptic distribution via PSD reorganization. A, A synapse viewed from the side (top) and from the top (bottom) illustrating the heterogeneous axial and lateral distribution of PSD proteins. Force generated from dynamic perisynaptic actin directly and constitutively regulates PSD lateral organization. We suspect that prolific intermolecular engagement within the PSD creates a sufficiently rigid structure to prevent mixing of PSD components over large distances. Alterations of the PSD interior in turn regulate subsynaptic AMPAR distribution, potentially by setting the position of either specific binding partners or local domains of nonspecific molecular crowding. While known binding interactions as well as the rank order of RF correlation values observed here imply a general sequence of molecular interactions that could relay information from filaments to receptors, there is not a great deal of evidence to support a specific molecular mechanism; the highly interconnected nature of PSD proteins suggests there may be many alternatives. B, Latrunculin depolymerizes spine actin filaments and at least in young neurons induces a partial loss of some PSD scaffold components. The loss of dynamic actin filaments blocks both morphology changes and subsynaptic receptor-scaffold reorganization. Receptors remain stably anchored within subsynaptic domains for long periods. While eventually the number of receptors in the synapse decreases, this is likely due to alterations in extrasynaptic receptor trafficking, not disruption of receptor stability in the synapse. C, Jasplakinolide treatment blocks synapse morphology changes and subsynaptic receptor-scaffold reorganization by preventing actin dynamics. Jasplakinolide does not strip away PSD components and does not elicit a reduction in receptor numbers, but prevents force generation and halts actin-driven reorganization of the PSD interior.

Comment in

Similar articles

Cited by

References

    1. Ackermann M, Matus A. Activity-induced targeting of profilin and stabilization of dendritic spine morphology. Nat Neurosci. 2003;6:1194–1200. - PubMed
    1. Allen PB, Ouimet CC, Greengard P. Spinophilin, a novel protein phosphatase 1 binding protein localized to dendritic spines. Proc Natl Acad Sci U S A. 1997;94:9956–9961. - PMC - PubMed
    1. Allison DW, Gelfand VI, Spector I, Craig AM. Role of actin in anchoring postsynaptic receptors in cultured hippocampal neurons: differential attachment of NMDA versus AMPA receptors. J Neurosci. 1998;18:2423–2436. - PMC - PubMed
    1. Arendt KL, Royo M, Fernández-Monreal M, Knafo S, Petrok CN, Martens JR, Esteban JA. PIP3 controls synaptic function by maintaining AMPA receptor clustering at the postsynaptic membrane. Nat Neurosci. 2010;13:36–44. - PMC - PubMed
    1. Ashby MC, De La Rue SA, Ralph GS, Uney J, Collingridge GL, Henley JM. Removal of AMPA receptors (AMPARs) from synapses is preceded by transient endocytosis of extrasynaptic AMPARs. J Neurosci. 2004;24:5172–5176. - PMC - PubMed

Publication types