. 2012 Feb;135(Pt 2):596-614.
doi: 10.1093/brain/awr331. Epub 2012 Jan 9.

Parietofrontal integrity determines neural modulation associated with grasping imagery after stroke

Affiliations

Parietofrontal integrity determines neural modulation associated with grasping imagery after stroke

Ethan R Buch et al. Brain. 2012 Feb.

Abstract

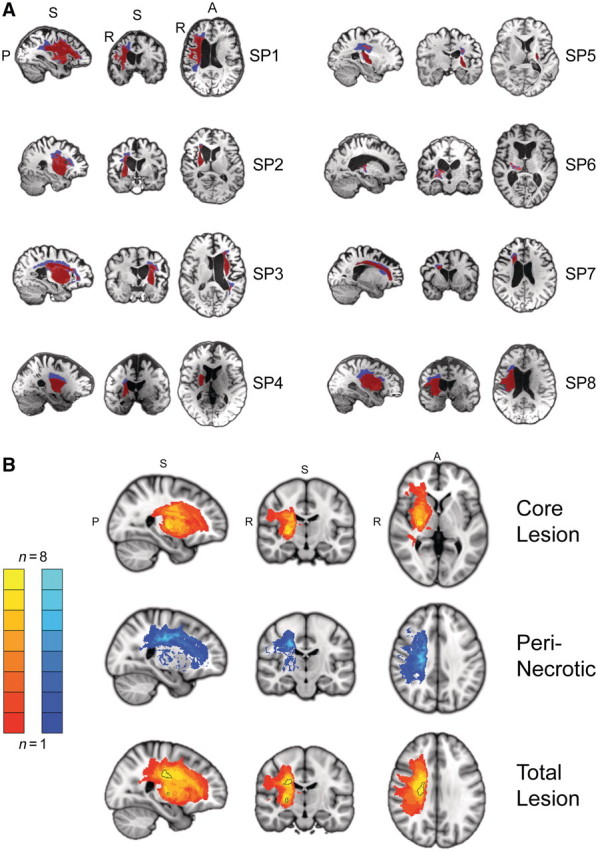
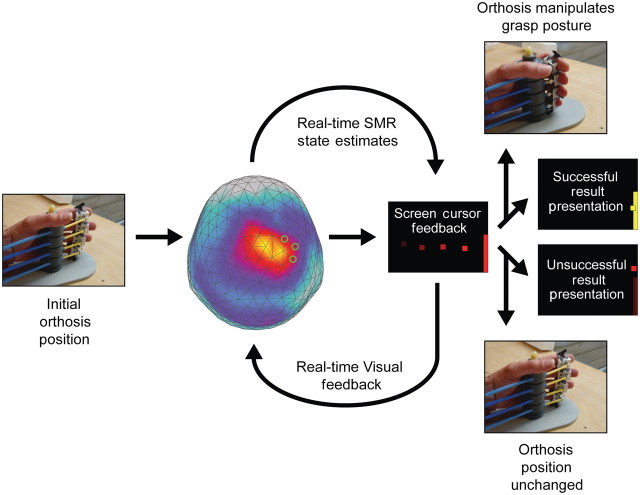
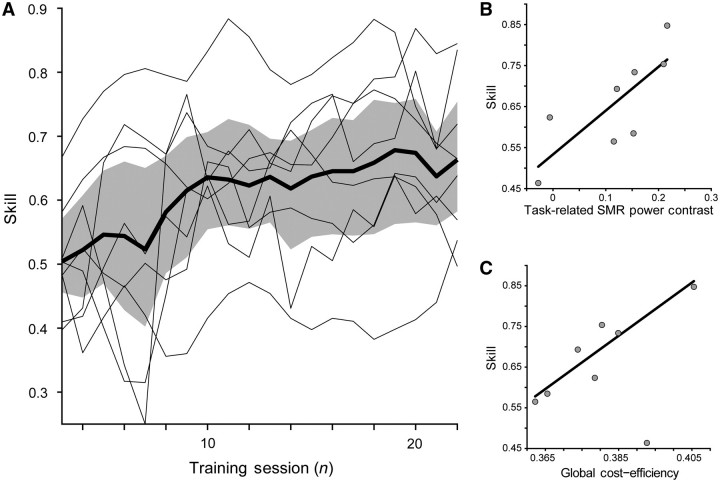
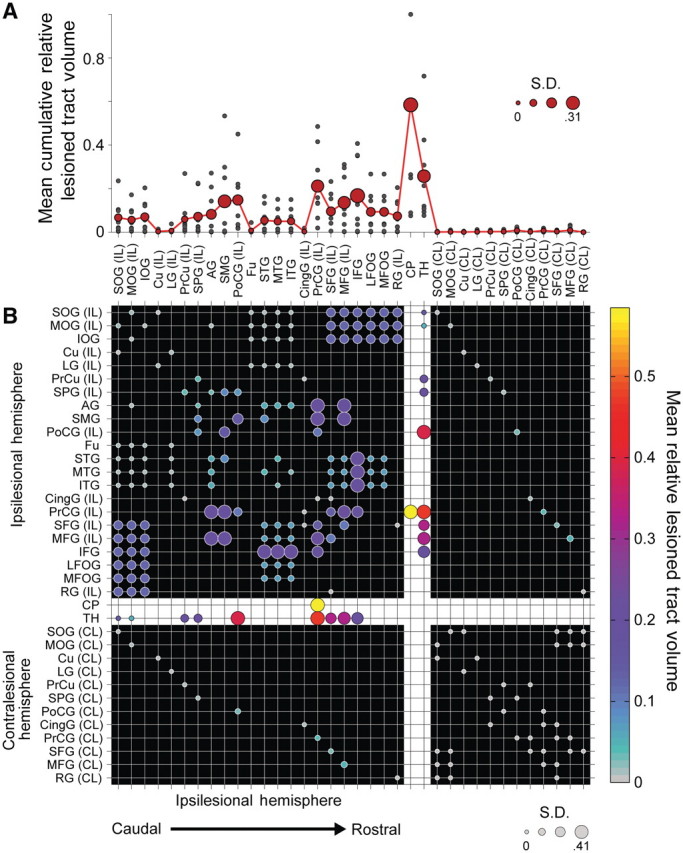
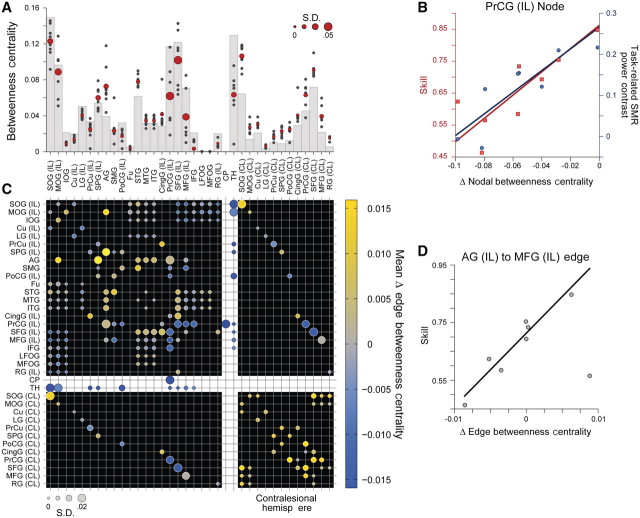
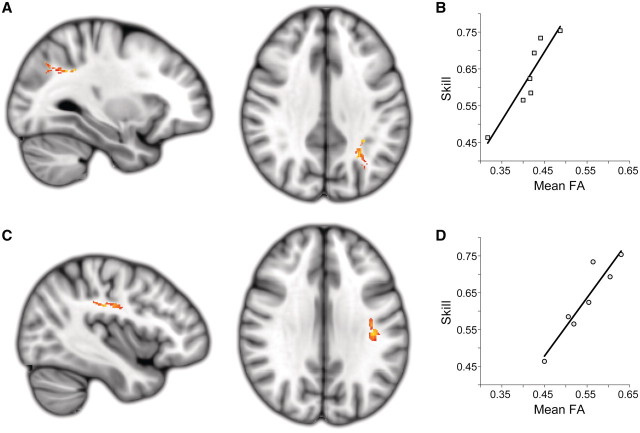
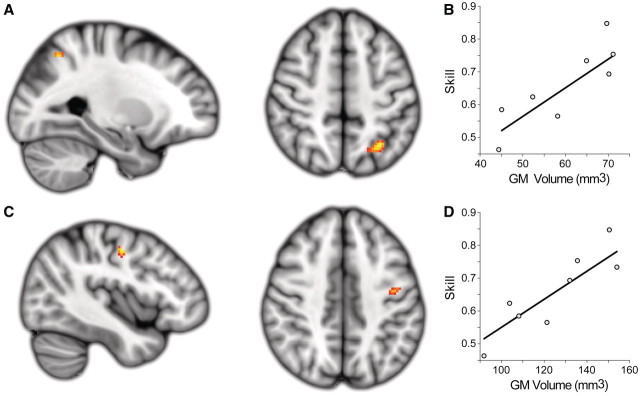
Chronic stroke patients with heterogeneous lesions, but no direct damage to the primary sensorimotor cortex, are capable of longitudinally acquiring the ability to modulate sensorimotor rhythms using grasping imagery of the affected hand. Volitional modulation of neural activity can be used to drive grasping functions of the paralyzed hand through a brain-computer interface. The neural substrates underlying this skill are not known. Here, we investigated the impact of individual patient's lesion pathology on functional and structural network integrity related to this volitional skill. Magnetoencephalography data acquired throughout training was used to derive functional networks. Structural network models and local estimates of extralesional white matter microstructure were constructed using T(1)-weighted and diffusion-weighted magnetic resonance imaging data. We employed a graph theoretical approach to characterize emergent properties of distributed interactions between nodal brain regions of these networks. We report that interindividual variability in patients' lesions led to differential impairment of functional and structural network characteristics related to successful post-training sensorimotor rhythm modulation skill. Patients displaying greater magnetoencephalography global cost-efficiency, a measure of information integration within the distributed functional network, achieved greater levels of skill. Analysis of lesion damage to structural network connectivity revealed that the impact on nodal betweenness centrality of the ipsilesional primary motor cortex, a measure that characterizes the importance of a brain region for integrating visuomotor information between frontal and parietal cortical regions and related thalamic nuclei, correlated with skill. Edge betweenness centrality, an analogous measure, which assesses the role of specific white matter fibre pathways in network integration, showed a similar relationship between skill and a portion of the ipsilesional superior longitudinal fascicle connecting premotor and posterior parietal visuomotor regions known to be crucially involved in normal grasping behaviour. Finally, estimated white matter microstructure integrity in regions of the contralesional superior longitudinal fascicle adjacent to primary sensorimotor and posterior parietal cortex, as well as grey matter volume co-localized to these specific regions, positively correlated with sensorimotor rhythm modulation leading to successful brain-computer interface control. Thus, volitional modulation of ipsilesional neural activity leading to control of paralyzed hand grasping function through a brain-computer interface after longitudinal training relies on structural and functional connectivity in both ipsilesional and contralesional parietofrontal pathways involved in visuomotor information processing. Extant integrity of this structural network may serve as a future predictor of response to longitudinal therapeutic interventions geared towards training sensorimotor rhythms in the lesioned brain, secondarily improving grasping function through brain-computer interface applications.


Figures

Figure 1
Figure 1
Brain lesions. (A) Sagittal, coronal and axial views of individual subject T1-weighted MRI scans with segmented brain lesions. A secondary segmentation of the total lesion was implemented to distinguish between core (red) and peri-necrotic (blue) regions based on differences in T1 signal intensity. Slices for each view are shown at the centre of gravity location for the core lesion. (B) Group core lesion (top; slices through MNI coordinate x = 26, y = −15, z = 2), peri-necrotic lesion (middle; 24, −18, 35) and total lesion (bottom; 25, −15, 29) probability maps displayed in MNI152 space. Left hemisphere lesions for Patients SP3 and SP5 have been flipped to the right-side. Two clusters (outlined in black) within the group lesion probability map show an overlap of at least seven of eight patients. The first cluster (517 mm3 volume; centre of gravity: 23.16, −14.57, 29.23) is located within the superior portion of the corona radiata, while a smaller more inferior cluster (60 mm3 volume; 25.38, −14.17, 2.87) is located in the external medullary lamina.
Figure 2
Figure 2
Trial description for sensorimotor rhythm (SMR) modulation through grasping imagery training. Whole-head magnetoencephalography data were continuously recorded throughout each training block (48 trials). At the initiation of each trial, one of two targets (top-right or bottom-right edge of visual display) appeared on a projection screen positioned in front of the subject. A screen cursor appeared at the left edge of the screen 500 ms later, and began moving towards the right edge at a fixed rate. Sensorimotor rhythm power modulation was estimated from a preselected subset of the sensor array (three to four source sensors) at 150-ms intervals throughout the trial (4 s duration), and compared to an adaptive baseline that characterized the midpoint between the power distribution means for each task state (target/orthosis action conditions). The distance of the current power state from this baseline was transformed into an upwards (positive) or downwards (negative) deflection of the screen cursor's vertical position, with an update rate of 6.7 Hz. At the conclusion of the trial, if the subject successfully deflected the cursor to contact the target, two simultaneous reinforcement events occurred. The cursor and target on the display changed colours from red to yellow, and the orthosis manipulated the impaired hand's grasp posture to the alternative state (opening or closing of hand). If the cursor did not successfully contact the target, no orthosis action was initiated.
Figure 3
Figure 3
Skill, task-related sensorimotor rhythm power contrast, and global functional network cost-efficiency. (A) Sensorimotor rhythm (SMR) modulation skill. Skill was defined as the proportion of correct trials for each training session, and showed a significant increase for the group [t(7) = 3.77; P < 0.01]. Group mean (thick black line) is shown with the 95% confidence intervals (shaded grey area). Individual subject curves (thin black lines) are overlaid to illustrate the variability across the group. (B) Task-related sensorimotor rhythm power contrast between target conditions showed a significant positive relationship with final success rate [β = 1.07, t(7) = 2.91, P < 0.05]. (C) Global cost-efficiency across the entire magnetoencephalography array shows a significant positive relationship with acquired sensorimotor rhythm modulation skill [β = 6.54, t(7) = 3.08, P < 0.05].
Figure 4
Figure 4
Mean impact of lesions on structural connectivity patterns. Fifty corticospinal, thalamocortical, short and long association fibre, and transcallosal tracts and their 36 related seed and target regions of interest from the JHU Probabilistic Fibre Atlas (Zhang et al., 2010), were used to construct weighted, undirected structural network connectivity matrices for the ipsilesional hemisphere in each patient. (A) Cumulative mean fibre damage for all tracts connected to a network node (red filled circles). Individual patient values are also displayed (small grey filled circles). Diameter of the red-filled circles is proportional to the group SD for each node, relevant to the evaluation of interindividual differences in skill. (B) Group mean symmetric network matrix showing the mean fibre tract damage for each edge (1—connectivity value). Filled circles located at grid-line intersections represent existing edges (connections) in the network. Rows and columns with the white background (dividing the rest of the matrix into quadrants) contain edges representing corticospinal and thalamocortical fibre pathways. Edges representing ipsilesional hemisphere short and long association fibres are located in the top-left quadrant (with the black background). Transcallosal fibre pathway edges are located in lower-left and upper-right quadrants. Contralesional hemisphere short and long association fibre edges between contralesional nodes directly connected to ipsilesional nodes through transcallosal pathways are located in the lower-right quadrant. Circle diameter is proportional to the SD of lesion damage to a particular tract across patients. Large diameter circles highlight edges with relatively high damage variability across the group. Circle colours reflect the group mean fibre tract damage. Grey coloured circles represent edges that are undamaged in all patients (see colour bar scale). Note the most severe damage occurs in the corticospinal tract as indicated by bright yellow circles. Additionally, there is moderate damage to ipsilesional short and long association fibre tracts connecting premotor, sensorimotor and posterior parietal regions as shown in large magenta circles. AG = angular gyrus; CingG = cingulate gyrus; CL = contralateral; CP = cerebral peduncle; Cu = cuneus; Fu = fusiform gyrus; IFG = inferior frontal gyrus; IL = ipsilateral; IOG = inferior occipital gyrus; LFOG = lateral fronto-orbital gyrus; LG = lingual gyrus; MFG = middle frontal gyrus; MFOG = middle fronto-orbital gyrus; MOG = middle occipital gyrus; MTG = middle temporal gyrus; PoCG = post-central gyrus; PrCG = precentral gyrus; PrCu = pre-cuneus; RG = rectus gyrus; SFG = superior frontal gyrus; SMG = supramarginal gyrus; SOG = superior occipital gyrus; SPG = superior parietal gyrus; STG = superior temporal gyrus; TH = thalamus.
Figure 5
Figure 5
Structural network nodal and edge betweenness centrality and skill. Nodal betweenness centrality characterizes the influence of a single node over the sharing of information between other nodes. (A) Grey bars show nodal betweenness centrality values for each node in an intact network prior to the inclusion of lesions (Zhang et al., 2010). Red circles show the group mean betweenness centrality for each network node following lesion inclusion. Circle diameter is proportional to the SD of nodal betweenness centrality across patients. Small grey filled circles show individual patient values. (B) Lesion-induced changes in precentral gyrus nodal betweenness centrality correlates with both skill [β = 0.003, t(7) = 3.42, P < 0.05], and task-related sensorimotor rhythm power contrast between target conditions [β = 0.002, t(7) = 4.11, P < 0.01]. (C) Group mean symmetric network matrix showing the mean lesion-induced change in betweenness centrality for each edge following application of lesion damage to the network. As in Fig. 4, filled circles located at grid-line intersections represent existing edges (connections) in the network. Rows and columns with the white background (dividing the rest of the matrix into quadrants) contain edges representing corticospinal and thalamocortical fibre pathways. Edges representing ipsilesional hemisphere short and long association fibres are located in the top-left quadrant (with the black background). Transcallosal fibre pathway edges are located in lower-left and upper-right quadrants. Contralesional hemisphere short and long association fibre edges between contralesional nodes directly connected to ipsilesional nodes through transcallosal pathways are located in the lower-right quadrant. Circle diameter is proportional to the SD in edge betweenness centrality difference across patients. Large diameter circles highlight edges with relatively high betweenness centrality variability across the group. Circle colours reflect the group mean edge betweenness centrality difference. Grey coloured circles indicate edges where betweenness centrality did not change (see colour bar scale). (D) Change in edge betweenness centrality measured for the connection between the ipsilesional angular gyrus and middle frontal gyrus shows a significant positive relationship with skill [β = 0.041, t(7) = 5.29, P < 0.005]. It should be noted that damage caused by lesions (Fig. 4) induces a complex pattern of changes in the relative influence of ipsilesional hemisphere nodes and ipsilesional association fibre and interhemispheric edges on global network integration. However, the influence of contralesional nodes and edges displays a uniform relative increase, as damage in the opposite hemisphere enhances their role in integrating information between frontal and parietal regions of the brain. AG = angular gyrus; CingG = cingulate gyrus; CL = contralateral; CP = cerebral peduncle; Cu = cuneus; Fu = fusiform gyrus; IFG = inferior frontal gyrus; IL = ipsilateral; IOG = inferior occipital gyrus; LFOG = lateral fronto-orbital gyrus; LG = lingual gyrus; MFG = middle frontal gyrus; MFOG = medial fronto-orbital gyrus; MOG = middle occipital gyrus; MTG = middle temporal gyrus; PoCG = post-central gyrus; PrCG = precentral gyrus; PrCu = pre-cuneus; RG = rectus gyrus; SFG = superior frontal gyrus; SMG = supramarginal gyrus; SMR = sensorimotor rhythm; SOG = superior occipital gyrus; SPG = superior parietal gyrus; STG = superior temporal gyrus; TH = thalamus.
Figure 6
Figure 6
Extralesional white matter fractional anisotropy (FA) related to skill. Two white matter clusters in the contralesional hemisphere were the only locations where there was a significant positive relationship between extralesional fractional anisotropy and acquired sensorimotor rhythm modulation skill across the stroke patient group. (A and B) A caudal region of the contralesional superior longitudinal fascicle adjacent to the anterior intra-parietal sulcus (cluster size = 105; max t-stat = 7.94; MNI location = −29, −56, 35). (C and D) A central region of the contralesional superior longitudinal fascicle underlying sensorimotor cortex (cluster size = 96; max t-stat = 12.37; MNI location = −38, −21, 32). Both clusters are significant at the level of P < 0.05 (corrected). Note that all lesioned areas were excluded from this analysis.
Figure 7
Figure 7
Extralesional grey matter (GM) volume related to skill. A region of interest-based voxel-based morphometry analysis of grey matter regions co-localized to regions of fractional anisotropy that correlated with sensorimotor rhythm modulation skill revealed two complimentary clusters showing a positive correlation between grey matter volume and sensorimotor rhythm modulation skill. (A and B) A caudal cluster is located within the contralesional intraparietal sulcus (cluster volume = 440 mm3; max t-stat = 4.20; MNI location = −28, −60, 50). (C and D) A second cluster is located along the grey–white matter border of the rostral precentral gyrus and near the junction of rostral M1, ventral premotor cortex and the dorsal premotor cortex (cluster volume = 248 mm3; max t-stat = 3.87; MNI location = −42, −10, 46). Both clusters are significant at the level of P < 0.05 (corrected).

Similar articles

Cited by

References

    1. Achard S, Bullmore E. Efficiency and cost of economical brain functional networks. PLoS Comput Biol. 2007;3:e17. - PMC - PubMed
    1. Alstott J, Breakspear M, Hagmann P, Cammoun L, Sporns O. Modeling the impact of lesions in the human brain. PLoS Comput Biol. 2009;5:e1000408. - PMC - PubMed
    1. Ang KK, Guan C, Chua KS, Ang BT, Kuah C, Wang C, et al. Clinical study of neurorehabilitation in stroke using EEG-based motor imagery brain-computer interface with robotic feedback. Conf Proc IEEE Eng Med Biol Soc. 2010;2010:5549–52. - PubMed
    1. Bai O, Lin P, Vorbach S, Floeter MK, Hattori N, Hallett M. A high performance sensorimotor beta rhythm-based brain-computer interface associated with human natural motor behavior. J Neural Eng. 2008;5:24–35. - PubMed
    1. Bassett DS, Bullmore ET, Meyer-Lindenberg A, Apud JA, Weinberger DR, Coppola R. Cognitive fitness of cost-efficient brain functional networks. Proc Natl Acad Sci USA. 2009;106:11747–52. - PMC - PubMed

Publication types