Lipolysis response to endoplasmic reticulum stress in adipose cells
- PMID: 22223650
- PMCID: PMC3307255
- DOI: 10.1074/jbc.M111.299115
Lipolysis response to endoplasmic reticulum stress in adipose cells
Abstract
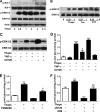
In obesity and diabetes, adipocytes show significant endoplasmic reticulum (ER) stress, which triggers a series of responses. This study aimed to investigate the lipolysis response to ER stress in rat adipocytes. Thapsigargin, tunicamycin, and brefeldin A, which induce ER stress through different pathways, efficiently activated a time-dependent lipolytic reaction. The lipolytic effect of ER stress occurred with elevated cAMP production and protein kinase A (PKA) activity. Inhibition of PKA reduced PKA phosphosubstrates and attenuated the lipolysis. Although both ERK1/2 and JNK are activated during ER stress, lipolysis is partially suppressed by inhibiting ERK1/2 but not JNK and p38 MAPK and PKC. Thus, ER stress induces lipolysis by activating cAMP/PKA and ERK1/2. In the downstream lipolytic cascade, phosphorylation of lipid droplet-associated protein perilipin was significantly promoted during ER stress but attenuated on PKA inhibition. Furthermore, ER stress stimuli did not alter the levels of hormone-sensitive lipase and adipose triglyceride lipase but caused Ser-563 and Ser-660 phosphorylation of hormone-sensitive lipase and moderately elevated its translocation from the cytosol to lipid droplets. Accompanying these changes, total activity of cellular lipases was promoted to confer the lipolysis. These findings suggest a novel pathway of the lipolysis response to ER stress in adipocytes. This lipolytic activation may be an adaptive response that regulates energy homeostasis but with sustained ER stress challenge could contribute to lipotoxicity, dyslipidemia, and insulin resistance because of persistently accelerated free fatty acid efflux from adipocytes to the bloodstream and other tissues.
Figures


Similar articles
-
Mechanisms of metformin inhibiting lipolytic response to isoproterenol in primary rat adipocytes.J Mol Endocrinol. 2009 Jan;42(1):57-66. doi: 10.1677/JME-08-0130. Epub 2008 Oct 27. J Mol Endocrinol. 2009. PMID: 18955435
-
Parathyroid hormone induces adipocyte lipolysis via PKA-mediated phosphorylation of hormone-sensitive lipase.Cell Signal. 2016 Mar;28(3):204-213. doi: 10.1016/j.cellsig.2015.12.012. Epub 2015 Dec 23. Cell Signal. 2016. PMID: 26724218
-
Bacterial endotoxin stimulates adipose lipolysis via toll-like receptor 4 and extracellular signal-regulated kinase pathway.J Biol Chem. 2009 Feb 27;284(9):5915-26. doi: 10.1074/jbc.M807852200. Epub 2009 Jan 3. J Biol Chem. 2009. PMID: 19122198
-
[Perilipin associated with lipid droplets regulates lipolysis].Sheng Li Ke Xue Jin Zhan. 2006 Jul;37(3):221-4. Sheng Li Ke Xue Jin Zhan. 2006. PMID: 17009729 Review. Chinese.
-
The central role of perilipin a in lipid metabolism and adipocyte lipolysis.IUBMB Life. 2004 Jul;56(7):379-85. doi: 10.1080/15216540400009968. IUBMB Life. 2004. PMID: 15545214 Review.
Cited by
-
1,3-Butanediol Administration Increases β-Hydroxybutyrate Plasma Levels and Affects Redox Homeostasis, Endoplasmic Reticulum Stress, and Adipokine Production in Rat Gonadal Adipose Tissue.Antioxidants (Basel). 2023 Jul 22;12(7):1471. doi: 10.3390/antiox12071471. Antioxidants (Basel). 2023. PMID: 37508009 Free PMC article.
-
Alternative Mechanism for White Adipose Tissue Lipolysis after Thermal Injury.Mol Med. 2016 May;21(1):959-968. doi: 10.2119/molmed.2015.00123. Epub 2015 Dec 29. Mol Med. 2016. PMID: 26736177 Free PMC article.
-
Lipid Storage, Lipolysis, and Lipotoxicity in Obesity.Adv Exp Med Biol. 2024;1460:97-129. doi: 10.1007/978-3-031-63657-8_4. Adv Exp Med Biol. 2024. PMID: 39287850 Review.
-
The role of hypoxia-inducible factor 1α in hepatic lipid metabolism.J Mol Med (Berl). 2023 May;101(5):487-500. doi: 10.1007/s00109-023-02308-5. Epub 2023 Mar 28. J Mol Med (Berl). 2023. PMID: 36973503 Review.
-
Endotoxin-induced alterations of adipose tissue function: a pathway to bovine metabolic stress.J Anim Sci Biotechnol. 2024 Apr 6;15(1):53. doi: 10.1186/s40104-024-01013-8. J Anim Sci Biotechnol. 2024. PMID: 38581064 Free PMC article. Review.
References
-
- Matthews C. K., van Holde K. E. (eds) (1996) Biochemistry, pp. 819–859, Benjamin-Cummings, Menlo Park, CA
-
- Londos C., Brasaemle D. L., Schultz C. J., Adler-Wailes D. C., Levin D. M., Kimmel A. R., Rondinone C. M. (1999) On the control of lipolysis in adipocytes. Ann. N.Y. Acad. Sci. 892, 155–168 - PubMed
-
- Arner P. (2002) Insulin resistance in type 2 diabetes. Role of fatty acids. Diabetes Metab. Res. Rev. 18, S5–S9 - PubMed
-
- Jensen M. D. (2007) Adipose tissue metabolism. An aspect we should not neglect? Horm. Metab. Res. 39, 722–725 - PubMed
Publication types
MeSH terms
Substances
LinkOut - more resources
Full Text Sources
Research Materials
Miscellaneous

