. 2012 Mar;23(5):834-52.
doi: 10.1091/mbc.E11-08-0731. Epub 2012 Jan 4.

Actin retrograde flow and actomyosin II arc contraction drive receptor cluster dynamics at the immunological synapse in Jurkat T cells

Affiliations

Actin retrograde flow and actomyosin II arc contraction drive receptor cluster dynamics at the immunological synapse in Jurkat T cells

Jason Yi et al. Mol Biol Cell. 2012 Mar.

Abstract

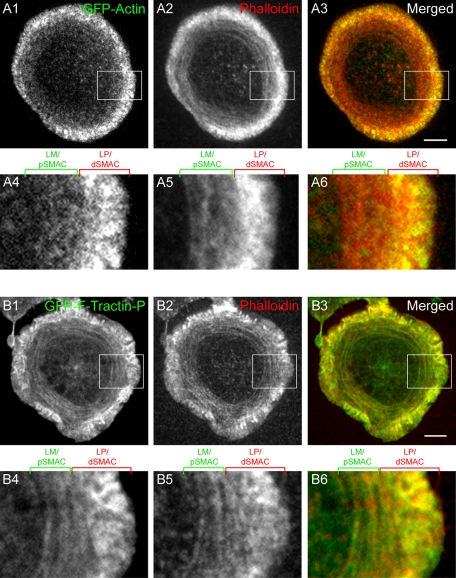
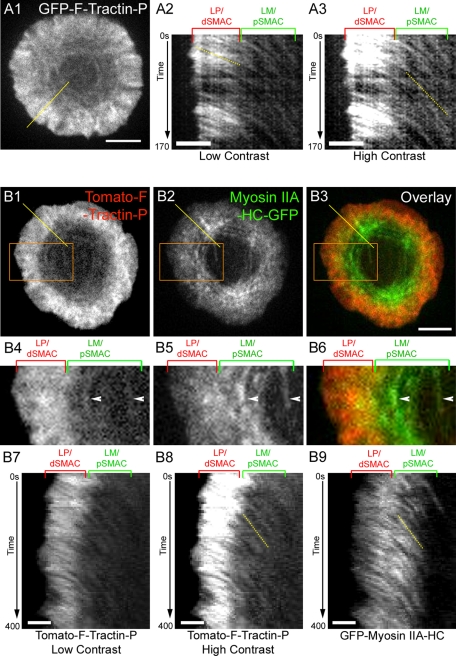
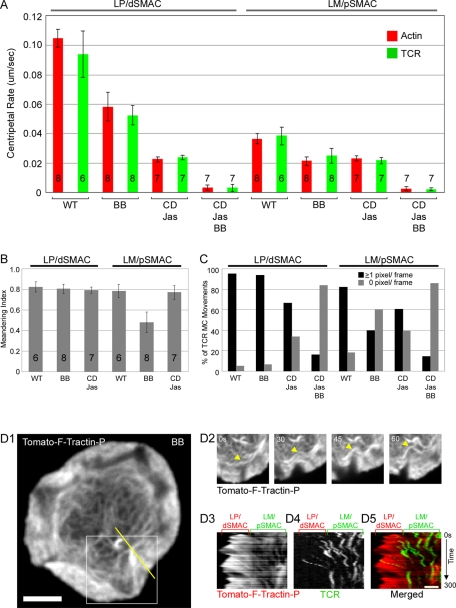
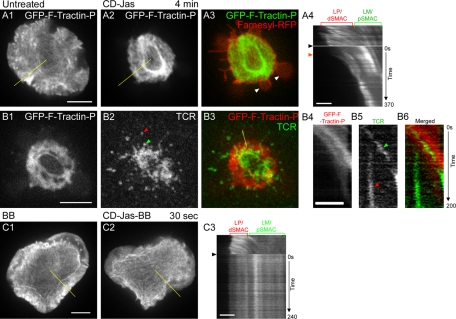
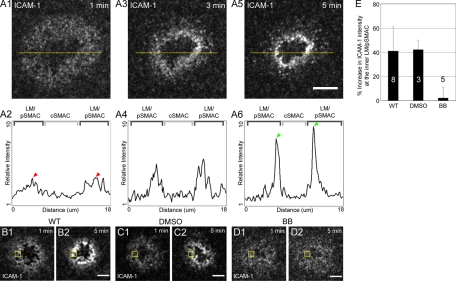
Actin retrograde flow and actomyosin II contraction have both been implicated in the inward movement of T cell receptor (TCR) microclusters and immunological synapse formation, but no study has integrated and quantified their relative contributions. Using Jurkat T cells expressing fluorescent myosin IIA heavy chain and F-tractin-a novel reporter for F-actin-we now provide direct evidence that the distal supramolecular activation cluster (dSMAC) and peripheral supramolecular activation cluster (pSMAC) correspond to lamellipodial (LP) and lamellar (LM) actin networks, respectively, as hypothesized previously. Our images reveal concentric and contracting actomyosin II arcs/rings at the LM/pSMAC. Moreover, the speeds of centripetally moving TCR microclusters correspond very closely to the rates of actin retrograde flow in the LP/dSMAC and actomyosin II arc contraction in the LM/pSMAC. Using cytochalasin D and jasplakinolide to selectively inhibit actin retrograde flow in the LP/dSMAC and blebbistatin to selectively inhibit actomyosin II arc contraction in the LM/pSMAC, we demonstrate that both forces are required for centripetal TCR microcluster transport. Finally, we show that leukocyte function-associated antigen 1 clusters accumulate over time at the inner aspect of the LM/pSMAC and that this accumulation depends on actomyosin II contraction. Thus actin retrograde flow and actomyosin II arc contraction coordinately drive receptor cluster dynamics at the immunological synapse.


Figures

FIGURE 1:
FIGURE 1:
Localization of endogenous F-actin structures and corresponding LP/LM markers at the Jurkat IS. (A) Phalloidin staining of endogenous F-actin at the IS in representative Jurkat T-cells stimulated on a supported planar bilayer (A1, A3) or on a glass coverslip coated with immobilized anti-CD3ε antibody (A5). (A2, A4, A6) Magnified images of the boxed regions (white) in A1, A3, and A5, respectively. The central zone, middle ring, and outer ring are indicated by brackets above A2, A4, and A6. (B) Overlap in localization of ICAM-1 with the middle ring of F-actin at the IS in a representative cell stimulated on a planar bilayer. Note that this image is a single frame from a movie of a cell expressing the F-actin reporter GFP–F-tractin-P (see the text) and not an image of a fixed, phalloidin-stained cell, as the distribution of ICAM-1 is disrupted by fixation. (B1) ICAM-1, (B3) GFP–F-tractin-P in the same cell, and (B5) merged image between B1 (green) and B3 (red). (B2, B4, B6) Magnified images of the boxed regions (white) in B1, B3, and B5, respectively. The outer and middle rings are indicated by brackets above B2, B4, and B6. (C) Overlap in localization of TCR MCs with the actin-depleted central zone at the IS in a representative cell stimulated on a planar bilayer. (C1) Anti-CD3ε antibody-labeled TCR MCs, (C2) phalloidin staining in the same cell, and (C3) merged image between C1 (green) and C2 (red). (D) Overlap in localization of the Arp2/3 complex with the outer ring of F-actin at the IS in a representative cell stimulated on a planar bilayer. (D1) Anti-p34 (Arp2/3 subunit) antibody staining, (D3) phalloidin staining in the same cell, and (D5) merged image between D1 (green) and D3 (red). (D2, D4, D6) Magnified images of the boxed regions (white) in D1, D3, and D5, respectively. The LP and LM regions are indicated by brackets above D2, D4, and D6. (E) Overlap in localization of myosin IIA with the middle ring of F-actin at the IS in a representative cell stimulated on planar bilayer. (E1) Anti–myosin IIA antibody staining, (E3) phalloidin staining in the same cell, and (E5) merged image between E1 (green) and E3 (red). (E2, E4, E6) Magnified images of the boxed regions (white) in E1, E3, and E5, respectively. The LP and LM regions are indicated by brackets above E2, E4, and E6. (F) Phalloidin staining at the plane of contact with the bilayer (F1) and 1 μm above the plane of contact with the bilayer (F2) in a representative cell stimulated on a planar bilayer. (F3) Graph showing the relative intensities of phalloidin fluorescence across the IS for the green line in F1 (and the corresponding green intensity trace in F3) and the red line in F2 (and the corresponding red intensity trace in F3). The positions of the LP/dSMAC, LM/pSMAC and cSMAC regions are indicated by brackets above F3. (G) Three-dimensional reconstructed views of phalloidin staining in a representative Jurkat cell stimulated on a planar bilayer. (G1) En face view of phalloidin fluorescence at the plane of contact with the bilayer. (G2) Cross-sectional view of phalloidin fluorescence in the LP/dSMAC region (corresponding to the red line in G1). (G3) Cross-sectional view of phalloidin fluorescence in the LM/pSMAC region (corresponding to the green line in G1). (H) Cartoon of the LP/dSMAC, LM/pSMAC, and cSMAC regions at the IS shown from an en face view (H1) and a side view (H2). Scale bars, 5 μm.
FIGURE 2:
FIGURE 2:
Comparison of F-actin structures at the IS reported by GFP-actin and mGFP–F-tractin-P. (A) F-Actin structures reported at the IS by GFP-actin and phalloidin in a representative Jurkat cell fixed after engagement on a planar bilayer. (A1) GFP-actin, (A2) phalloidin staining in the same cell, and (A3) merged image between A1 (green) and A2 (red). (A4–A6) Magnified images of the boxed regions (white) in A1–A3, respectively. (B) F-Actin structures at the IS reported by GFP–F-tractin-P and phalloidin in a representative Jurkat cell fixed after stimulation on a planar bilayer. (B1) GFP–F-tractin-P, (B2) phalloidin staining in the same cell, and (B3) merged image between B1 (green) and B2 (red). (B4–B6) Magnified images of the boxed regions (white) in B1–B3, respectively. The positions of the LP/dSMAC and LM/pSMAC regions of the IS are indicated by the brackets above A4–A6 and B4–B6. Scale bars, 5 μm.
FIGURE 3:
FIGURE 3:
Characterization of F-actin dynamics in the LP/dSMAC and LM/pSMAC regions of the IS. (A) Centripetal actin flow in the LP/dSMAC and LM/pSMAC regions of the IS observed using GFP–F-tractin-P in a representative Jurkat cell stimulated on a planar lipid bilayer (see also Supplemental Movie S1). (A1) F-Actin reported by GFP–F-tractin-P at the IS. (A2, A3) Kymograph of GFP–F-tractin-P in the region corresponding to the yellow line in A1, shown in low contrast (A2) and high contrast (A3). In this and all subsequent kymographs, the shallower the slope, the faster is the speed, and the steeper the slope, the slower is the speed. Dotted yellow lines were added to demonstrate the distinct slopes in the LP/dSMAC (A2) and LM/pSMAC (A3). (B) Centripetal flow of F-actin and myosin IIA at the IS in a representative cell engaged on a bilayer (see also Supplemental Movie S3). (B1) tdTomato–F-tractin-P, (B2) GFP–myosin IIA HC in the same cell, and (B3) merged image between B1 (red) and B2 (green). (B4–B6) Magnified images of the boxed regions (orange) in B1–B3, respectively. White arrowheads indicate two arcs present in the LM/pSMAC that clearly possess both F-actin and myosin IIA. (B7) Low-contrast kymograph of tdTomato–F-tractin-P in the region corresponding to the yellow line in B1. (B8) High-contrast kymograph of tdTomato–F-tractin-P in the region corresponding to the yellow line in B1. (B9) Kymograph of GFP–myosin IIA HC in the region corresponding to the yellow line in B2. Dotted yellow lines were added to highlight identical arc movement in the LM/pSMAC observed using Tomato–F-tractin-P (B8) and GFP–myosin IIA-HC (B9). The positions of the LP/dSMAC and LM/pSMAC regions of the IS are indicated by the brackets above A2, A3, B4–B6, and B7–B9. The time scales (in seconds) for all of the kymographs shown are indicated on the left. Scale bars in A1 and B3, 5 μm; in A2, A3, and B7, 2 μm.
FIGURE 4:
FIGURE 4:
Characterization of TCR MC dynamics at the LP/dSMAC and LM/pSMAC regions of the IS. (A) Time-lapse images showing TCR MC movements in the LP/dSMAC and LM/pSMAC regions of the IS in a representative Jurkat cell stimulated on a planar bilayer (see also Supplemental Movie S6). TCR MCs (pseudocolored green) reported by rhodamine X–labeled anti-CD3ε antibody in the bilayer. F-Actin (pseudocolored red) reported by GFP–F-tractin-P. White arrowheads point to a TCR MC undergoing inward movement. The frame at 40 s that is boxed in orange indicates the moment when this TCR MC moved from the LP/dSMAC into the LM/pSMAC during its centripetal movement. (B1) Kymograph of GFP–F-tractin-P in the region corresponding to the yellow line in A (0 s), (B2) kymograph of a TCR MC in the region corresponding to the yellow line in A (0 s), and (B3) merged image between B1 (red) and B2 (green). The positions of the LP/dSMAC and LM/pSMAC regions of the IS are indicated by the brackets above B1–B3. The boundary between the LP/dSMAC and LM/pSMAC is indicated by the orange line in B1–B3. The time scale of the kymographs in B1–B3 is indicated to the left of B1. (C) Paths of all visible TCR MCs in a representative Jurkat cell stimulated on a planar bilayer. TCR MC paths in the LP/dSMAC are shown in red, and TCR MC paths in the LM/pSMAC are shown in green. The paths are discontinuous because we purposely avoided making measurements at the dSMAC/pSMAC boundary. (D) Spatial and kinetic relationship between a TCR MC and surrounding actomyosin II arcs in the LM/pSMAC region of the IS (see also Supplemental Movie S7). (D1) GFP–myosin IIA HC (pseudocolored red) and TCR MCs (pseudocolored green) at the IS of a Jurkat cell stimulated on a planar bilayer. (D2) Magnified image of the boxed region (white) in D1. (D3) Relative intensities for myosin IIA (red) and a TCR MC (green) across the yellow line in D2. (D4) Kymograph of two prominent myosin IIA-containing arcs in the region corresponding to the yellow line in D1, (D5) kymograph of a TCR MC in the region corresponding to the yellow line in D1, and (D6) merged image between D4 (red) and D5 (green). The time scale of the kymographs in D4–D6 is indicated to the right of D6. Scale bars in A, B3, and D6, 2 μm; in D1, 5 μm.
FIGURE 5:
FIGURE 5:
Effect of blebbistatin on the dynamics of F-actin and TCR MCs in the LP/dSMAC and LM/pSMAC regions of the IS. (A) Graph showing the rates of centripetal movement (in μm/s) of actin (red) and TCR MCs (green) in the LP/dSMAC and LM/pSMAC regions of WT (in this study, WT is used to indicate untreated cells) and BB-, CD-Jas–, and CD-Jas-BB–treated Jurkat cells stimulated on planar bilayers. The bars indicate the mean and SD for the centripetal rate. The number of cells analyzed for each measurement is indicated inside (or above) the bar (∼50 TCR MCs were measured per cell). (B) Graph showing the meandering index (net displacement/total distance traveled) of TCR MCs measured in the LP/dSMAC and LM/pSMAC region of WT and BB- and CD-Jas–treated cells. Each bar shows the mean and SD for the meandering index. The number of cells analyzed for each measurement is indicated inside the bar. (C) Graph showing the percentage of TCR MCs that moved one or more pixels (black) or zero pixels (gray) per frame in the LP/dSMAC and LM/pSMAC regions of WT and BB-, CD-Jas–, and CD-Jas-BB–treated cells. The bars show the percentages of all measurements that fall in these two categories. (D) The effect of BB on the dynamics of actin arcs and the movements of TCR MCs in the LM/pSMAC region of the IS (see also Supplemental Movie S8). (D1) tdTomato–F-tractin-P at the IS in a BB-treated cell stimulated on a planar bilayer. (D2) Time-lapse images of the boxed region (white) in D1. The yellow arrowheads point to a buckling actin arc in the LM/pSMAC. (D3) Kymograph of Tomato–F-tractin-P in the region corresponding to the yellow line in D1, (D4) kymograph of TCR MCs in the region corresponding to the yellow line in D1, and (D5) merged image between D3 (red) and D4 (green). The positions of the LP/dSMAC and LM/pSMAC regions of the IS are indicated by the brackets above D3–D5. The time scale of the kymographs in D3–D5 is indicated to the right of D5. Scale bar in D1, 5 μm; in D4, 2 μm.
FIGURE 6:
FIGURE 6:
Testing the effects of CD, Jas, and CD-Jas treatments on actin retrograde flow in cells engaged on coverslips. (A) Effect of low-dose CD on the organization and dynamics of F-actin at the IS in a Jurkat cell stimulated on a coverslip substrate (see also Supplemental Movie S9). (A1) GFP–F-tractin-P at the IS before addition of low-dose CD. (A2) GFP–F-tractin-P at the IS of this same cell 4 min after addition of low-dose CD. (A3) Kymograph of GFP–F-tractin-P in the region corresponding to the yellow line in A2. (A4) Kymograph of GFP–F-tractin-P in the region corresponding to the red line in A2. The black and orange arrowheads in these two kymographs, as well as those in B4 and C4, mark the time when CD and/or Jas was added and when the LP network began to retract, respectively. (B) Effect of Jas on the organization and dynamics of F-actin at the IS in a Jurkat cell stimulated on a coverslip substrate (see also Supplemental Movie S10). (B1) GFP–F-tractin-P at the IS before addition of Jas. (B2) GFP–F-tractin-P at the IS in this same cell 4 min after addition of Jas. (B3) GFP–F-tractin-P at the IS in this same cell 6 min after addition of Jas. The pronounced rings of F-actin that accumulate following Jas addition at the boundary between LP/dSMAC and LM/pSMAC, and at the boundary between the LM/pSMAC and cSMAC, are indicated by the red and green arrowheads, respectively. (B4) Kymograph of GFP–F-tractin-P in the region corresponding to the yellow line in B2. (C) Effect of CD-Jas on the organization and dynamics of F-actin at the IS in a Jurkat cell stimulated on a coverslip substrate (see also Supplemental Movie S11). (C1) GFP–F-tractin-P at the IS before addition of CD-Jas. (C2) GFP–F-tractin-P at the IS in this same cell 4 min after addition of CD-Jas. (C3) Merged image between C2 (green) and farnesylated-RFP (red), which marks the plasma membrane. (C4) Kymograph of GFP–F-tractin-P in the region corresponding to the yellow line in C2. The positions of the LP/dSMAC and LM/pSMAC regions of the IS are indicated by the brackets above A3, A4, B4, and C5. The time scales (in seconds) for all of the kymographs shown are indicated on the right. Scale bars in A1, B1, and C1, 5 μm; in A3, A4, B3, and C4, 2 μm.
FIGURE 7:
FIGURE 7:
Inhibition of actin retrograde flow and actomyosin II arc contraction using combinations of CD, Jas, and BB. (A) Effect of CD-Jas treatment on the dynamics and distribution of F-actin at the IS of a Jurkat cell stimulated on a planar bilayer (see also Supplemental Movie S12). (A1) GFP–F-tractin-P at the IS of a cell before addition of CD-Jas. (A2) GFP–F-tractin at the IS of this same cell 4 min after addition of CD-Jas. (A3) Merged image between A2 (green) and farnesylated-RFP (red), which marks the plasma membrane. (A4) Kymograph of the region corresponding to the yellow line in A1 and A2. The black arrowhead indicates the time of CD-Jas addition, and the blue arrowhead indicates the start of actin retraction in the LP/dSMAC. (B) Effect of CD-Jas treatment on F-actin dynamics and distribution and on TCR MC movement at the IS of a Jurkat cell stimulated on a planar bilayer. (B1) GFP–F-tractin-P at the IS of a cell 4 min after addition of CD-Jas. (B2) TCR MCs at the IS of this same cell 4 min after addition of CD-Jas. The red arrowhead marks the position of a marooned TCR MC. The green arrowhead marks a TCR MC that moved with the retracting actin network. (B3) Merged image between B1 (red) and B2 (green). (B4) Kymograph of GFP–F-tractin-P in the region corresponding to the yellow line in B3, (B5) kymograph of TCR MCs in the region corresponding to the yellow line in B3, and (B6) merged image between B4 (red) and B5 (green). The red arrowhead in B5 indicates the immobile, marooned TCR MC marked in B2 that was left behind at the IS periphery, whereas the green arrowhead in B5 indicates the TCR MC marked in B2 that moved with the retracting actin network (see B6 for the overlay). (C) The effect of combined CD-Jas-BB treatment on F-actin dynamics and distribution at the IS of a Jurkat cell stimulated on a planar bilayer (see also Supplemental Movie S13). (C1) tdTomato–F-tractin-P at the IS of a BB-pretreated cell before addition of CD-Jas-BB. (C2) tdTomato–F-tractin-P at the IS of this same cell 30 s after addition of CD-Jas-BB. (C3) Kymograph of the region corresponding to the yellow line in C1 and C2. The black arrowhead in C3 indicates the time of CD-Jas-BB addition. The positions of the LP/dSMAC and LM/pSMAC regions of the IS are indicated by the brackets above A4 and C3. The time scales of the kymographs in A3, B4–B6, and C3 are indicated to the right of A4, B6, and C3, respectively. Scale bars in A1, B1, and C1, 5 μm; scale bars in A4, B3, and C3, 2 μm.
FIGURE 8:
FIGURE 8:
The effect of myosin II inhibition on the accumulation of LFA-1 clusters at the inner aspect of the LM/pSMAC. (A) Accumulation of LFA-1 clusters at the inner aspect of the LM/pSMAC in Jurkat cells stimulated on planar bilayers (see also Supplemental Movie S14). (A1) Distribution of LFA-1clusters, reported by Alexa 546–labeled ICAM-1 in the bilayer, at the IS of a Jurkat cell 1 min after engagement on a planar bilayer. (A3) LFA-1 clusters in the same cell 3 min after engagement. (A5) LFA-1 clusters in the same cell 5 min after engagement. (A2, A4, A6) Relative intensities of ICAM-1 fluorescence in the line scans (yellow lines) in A1, A3, and A5, respectively. Arrowheads indicate peaks of ICAM-1 fluorescence intensity in A2 (red) and A6 (green). (B–D) Distributions of LFA-1 clusters at the IS of WT and DMSO- and BB-treated Jurkat cells stimulated on planar bilayers. (B) LFA-1 clusters at the IS of a WT Jurkat cell 1 min (B1) and 5 min (B2) after engagement. (C) LFA-1 clusters at the IS of a DMSO-treated Jurkat cell 1 min (C1) and 5 min (C2) after engagement. (D) LFA-1 clusters at the IS of a BB-treated Jurkat cell 1 min (D1) and 5 min (D2) after engagement. (E) Percentage increase in the accumulation of ICAM-1 fluorescence at the inner aspect of the pSMAC (i.e., within the yellow boxed regions in B1–D2) 5 min after bilayer engagement in WT and DMSO- and BB-treated cells. The numbers of cells used per measurement are indicated inside (or above) the bar. Scale bar in A5, 5 μm; in B2, C2, and D2, 2 μm.

Similar articles

Cited by

References

    1. Aizawa H, Sameshima M, Yahara I. A green fluorescent protein-actin fusion protein dominantly inhibits cytokinesis, cell spreading, and locomotion in Dictyostelium. Cell Struct Funct. 1997;22:335–345. - PubMed
    1. Allingham JS, Smith R, Rayment I. The structural basis of blebbistatin inhibition and specificity for myosin II. Nat Struct Mol Biol. 2005;12:378–379. - PubMed
    1. Babich A, Burkhardt JK. Lymphocyte signaling converges on microtubules. Immunity. 2011;34:825–827. - PubMed
    1. Billadeau DD, Nolz JC, Gomez TS. Regulation of T-cell activation by the cytoskeleton. Nat Rev Immunol. 2007;7:131–143. - PubMed
    1. Bunnell SC, Barr VA, Fuller CL, Samelson LE. High-resolution multicolor imaging of dynamic signaling complexes in T cells stimulated by planar substrates. Sci STKE. 2003;2003:PL8. - PubMed

MeSH terms

LinkOut - more resources