

Association of C-reactive protein with cardiovascular disease mortality according to diabetes status: pooled analyses of 25,979 participants from four U.K. prospective cohort studies
- PMID: 22210562
- PMCID: PMC3263864
- DOI: 10.2337/dc11-1588
Association of C-reactive protein with cardiovascular disease mortality according to diabetes status: pooled analyses of 25,979 participants from four U.K. prospective cohort studies
Abstract
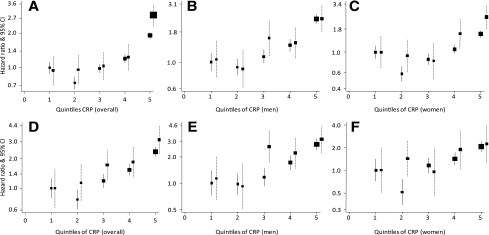
Objective: C-reactive protein (CRP) is associated with the risk of cardiovascular disease (CVD); whether the effects are modified by diabetes status still is unclear. This study investigated these issues and assessed the added value of CRP to predictions.
Research design and methods: Participants were drawn from representative samples of adults living in England and Scotland. Cox proportional hazards regression models were used to relate baseline plasma CRP with all-cause and CVD mortality during follow-up in men and women with and without diabetes. The added value of CRP to the predictions was assessed through c-statistic comparison and relative integrated discrimination improvement.
Results: A total of 25,979 participants (4.9% with diabetes) were followed for a median of 93 months, during which period there were 2,767 deaths (957 from CVD). CRP (per SD log(e)) was associated with a 53% (95% CI 43-64) and 43% (38-49) higher risk of cardiovascular and all-cause mortality, respectively. These associations were log linear and did not differ according to diabetes status (both P ≥ 0.08 for interaction), sex, and other risk factors. Adding CRP to conventional risk factors improved predictions overall and separately by diabetes status but not for CVD mortality, although such improvements only were marginal based on several discrimination statistics.
Conclusions: The association between CRP and CVD was similar across diabetes status, and the effects are broadly similar across levels of other conventional risk factors.
Figures
Similar articles
-
Gamma-glutamyltransferase and risk of cardiovascular disease mortality in people with and without diabetes: pooling of three British Health Surveys.J Hepatol. 2012 Nov;57(5):1083-9. doi: 10.1016/j.jhep.2012.06.034. Epub 2012 Jul 11. J Hepatol. 2012. PMID: 22796154
-
Fibrinogen and future cardiovascular disease in people with diabetes: aetiological associations and risk prediction using individual participant data from nine community-based prospective cohort studies.Diab Vasc Dis Res. 2013 Mar;10(2):143-51. doi: 10.1177/1479164112451588. Epub 2012 Jul 11. Diab Vasc Dis Res. 2013. PMID: 22786872
-
High-sensitivity C reactive protein as a predictor of inhospital mortality in patients with cardiovascular disease at an emergency department: a retrospective cohort study.BMJ Open. 2017 Oct 6;7(10):e015112. doi: 10.1136/bmjopen-2016-015112. BMJ Open. 2017. PMID: 28988163 Free PMC article.
-
Behavioral and Pharmacotherapy Weight Loss Interventions to Prevent Obesity-Related Morbidity and Mortality in Adults: An Updated Systematic Review for the U.S. Preventive Services Task Force [Internet].Rockville (MD): Agency for Healthcare Research and Quality (US); 2018 Sep. Report No.: 18-05239-EF-1. Rockville (MD): Agency for Healthcare Research and Quality (US); 2018 Sep. Report No.: 18-05239-EF-1. PMID: 30354042 Free Books & Documents. Review.
-
C-reactive protein for predicting cardiovascular and all-cause mortality in type 2 diabetic patients: A meta-analysis.Cytokine. 2019 May;117:59-64. doi: 10.1016/j.cyto.2019.02.005. Epub 2019 Feb 28. Cytokine. 2019. PMID: 30826600 Review.
Cited by
-
Effect of dipeptidyl peptidase-4 inhibitors on tumor necrosis factor alpha levels in patients with type 2 diabetes mellitus.Eur J Med Res. 2024 Jul 12;29(1):363. doi: 10.1186/s40001-024-01955-9. Eur J Med Res. 2024. PMID: 38997754 Free PMC article.
-
Proinflammatory cytokines, adiponectin, and increased risk of primary cardiovascular events in diabetic patients with or without renal dysfunction: results from the ESTHER study.Diabetes Care. 2013 Jun;36(6):1703-11. doi: 10.2337/dc12-1416. Epub 2013 Feb 1. Diabetes Care. 2013. PMID: 23378623 Free PMC article.
-
Sex and Race Differences in the Relationship between Obesity and C-Reactive Protein.Ethn Dis. 2016 Apr 21;26(2):197-204. doi: 10.18865/ed.26.2.197. Ethn Dis. 2016. PMID: 27103770 Free PMC article.
-
The interplay of inflammation, exosomes and Ca2+ dynamics in diabetic cardiomyopathy.Cardiovasc Diabetol. 2023 Feb 20;22(1):37. doi: 10.1186/s12933-023-01755-1. Cardiovasc Diabetol. 2023. PMID: 36804872 Free PMC article. Review.
-
Effect of resistance training on C-reactive protein, blood glucose and lipid profile in older women with differing levels of RT experience.Age (Dordr). 2015 Dec;37(6):109. doi: 10.1007/s11357-015-9849-y. Epub 2015 Oct 26. Age (Dordr). 2015. PMID: 26499819 Free PMC article.
References
-
- Dent TH. Predicting the risk of coronary heart disease: II: the role of novel molecular biomarkers and genetics in estimating risk, and the future of risk prediction. Atherosclerosis 2010;213:352–362 - PubMed
-
- Hingorani AD, Shah T, Casas JP, Humphries SE, Talmud PJ. C-reactive protein and coronary heart disease: predictive test or therapeutic target? Clin Chem 2009;55:239–255 - PubMed
-
- Danesh J, Wheeler JG, Hirschfield GM, et al. C-reactive protein and other circulating markers of inflammation in the prediction of coronary heart disease. N Engl J Med 2004;350:1387–1397 - PubMed
-
- Keavney B. C reactive protein and the risk of cardiovascular disease. BMJ 2011;342:d144. - PubMed
-
- Fortmann SP, Ford E, Criqui MH, et al. ; Centers for Disease Control and Prevention; American Heart Association CDC/AHA Workshop on Markers of Inflammation and Cardiovascular Disease: application to clinical and public health practice: report from the population science discussion group. Circulation 2004;110:e554–e559 - PubMed
MeSH terms
Substances
LinkOut - more resources
Full Text Sources
Medical
Research Materials
Miscellaneous
