. 2011 Dec 23;35(6):871-82.
doi: 10.1016/j.immuni.2011.09.021.

The transcription factor Myc controls metabolic reprogramming upon T lymphocyte activation

Affiliations

The transcription factor Myc controls metabolic reprogramming upon T lymphocyte activation

Ruoning Wang et al. Immunity. .

Abstract

To fulfill the bioenergetic and biosynthetic demand of proliferation, T cells reprogram their metabolic pathways from fatty acid β-oxidation and pyruvate oxidation via the TCA cycle to the glycolytic, pentose-phosphate, and glutaminolytic pathways. Two of the top-ranked candidate transcription factors potentially responsible for the activation-induced T cell metabolic transcriptome, HIF1α and Myc, were induced upon T cell activation, but only the acute deletion of Myc markedly inhibited activation-induced glycolysis and glutaminolysis in T cells. Glutamine deprivation compromised activation-induced T cell growth and proliferation, and this was partially replaced by nucleotides and polyamines, implicating glutamine as an important source for biosynthetic precursors in active T cells. Metabolic tracer analysis revealed a Myc-dependent metabolic pathway linking glutaminolysis to the biosynthesis of polyamines. Therefore, a Myc-dependent global metabolic transcriptome drives metabolic reprogramming in activated, primary T lymphocytes. This may represent a general mechanism for metabolic reprogramming under patho-physiological conditions.


Figures

Figure 1
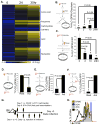
Figure 1. Stimulation of TCR and CD28 drives T cell metabolic reprogramming
(A) Intracellular metabolites in T cells collected at the indicated times after activation were profiled by mass spectroscopy. The value for each metabolite represents the average of triplicates and the amount of each metabolite in resting T cells was set to 1. The heat map represents the log2 value of the relative amount of each metabolite, which was grouped in the indicated metabolic pathways (see color scale). The complete metabolomic profile is provided in Table S1. (B–F) Metabolic assays, with the isotopically-labeled tracer used highlighted in red (left panel). Resting T cells (Rest) and activated T cells (collected at 24h after activation in D, E and F or at the indicated times after activation in B and C) were used for measuring the generation of 3H2O from [3-3H]-glucose (glycolysis, right panel in B) or from [9,10-3H]-palmitic acid (FAO, right panel in C); the generation of 14CO2 from [2-14C]-pyruvate (TCA, right panel in D), from [U-14C]-glutamine (glutaminolysis, right panel in E), or from [1-14C]-glucose (PPP, right panel in F). Error bars represent standard deviation from the mean of triplicate samples. Data are representative of three independent experiments. (G) Overview of the experimental procedure used for assessing OT-II T cell proliferation in vivo (Fig. 1H). (H) Naïve OT-II T cells (CD45.1+) cells were CFSE labeled and transferred into C57BL/6 mice, which were immunized with OVA and treated daily with the indicated inhibitors or vehicle controls. Splenocytes were analyzed 3 days after immunization and OT-II cell proliferation was determined by flow cytometry. Data represent two independent experiments.
Figure 2
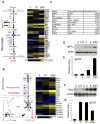
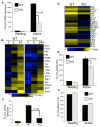
Figure 2. T cell activation drives the transcription of a distinct set of metabolic genes
(A–B) The glycolytic pathway (left panel in A) and the glutaminolytic pathway (left panel in B), with the metabolic genes measured highlighted in blue. RNA was isolated from T cells collected at the indicated times after activation, and used for qPCR analyses of metabolic genes in the glycolytic pathway (right panel in A) and the glutaminolytic pathway (right panel in B). mRNA levels in resting T cells were set to 1. The heat map represents the log2 value of the relative mRNA expression level (see color scale). Values and standard deviations are provided in Table S2. Data are representative of two independent experiments. (C) The top ten predicted corresponding transcription factors and motifs were ranked in descending order of association score, which indicates the likelihood of the binding of a particular transcription factor to the input gene promoters correlating with the expression levels. The input gene list and expression profile is provided in Table S3. (D–G) Protein and mRNA expression of HIF1α (D and E, respectively) and of Myc (F and G, respectively) in T cells collected at the indicated times after activation were determined by Immunoblot and qPCR. mRNA levels in resting T cells were set to 1. Error bars represent standard deviation from the mean of triplicate samples. Data are representative of two independent experiments.
Figure 3
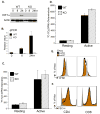
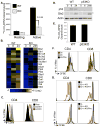
Figure 3. HIF1α is not required for activation-induced metabolic reprogramming
(A–B) T cells were isolated from RosaCreERT2/HIF1αflox/flox mice and pretreated with vehicle (WT) or with 500 nM 4OHT (KO). HIF1α protein and mRNA levels in T cells collected at the indicated times after activation were determined by Immunoblot (A) and qPCR (B). mRNA levels in resting WT T cells were set to 1. (C–D) Glycolysis and glutaminolysis as determined by the generation of 3H2O from [3-3H]-glucose (C) and the generation of 14CO2 from [U-14C]-glutamine (D), respectively. Error bars in B–D represent standard deviation from the mean of triplicate samples. Data are representative of two independent experiments. (E) Cell proliferation of resting (Rest), active WT and KO T cells (48hr) was determined as CFSE dilution. (F) Cell size of resting (Rest), active WT and KO T cells (24hr) was determined as forward light scatter.
Figure 4
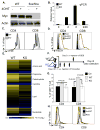
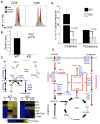
Figure 4. Myc is required for T cell growth and proliferation
(A) T cells isolated from either RosaCreERTam-MycWT/WT mice (WT) or RosaCreERTam-Mycflox/flox mice (flox/flox) were pretreated with vehicle (−4OHT) or with 500 nM 4OHT (+4OHT). Myc protein levels were determined at the indicated times after activation by immuoblot. (B) Myc mRNA levels in T cells collected at the indicated times after activation as determined by qPCR. mRNA levels in resting WT T cells were set to 1. Error bars represent standard deviation from the mean of triplicate samples. Data are representative of two independent experiments. (C) Cell proliferation of active T cells (48hr) was determined as CFSE dilution. (D) Cell size of resting (Rest) and active T cells (24hr) was determined as forward light scatter. (E) The level of intracellular metabolites in the indicated samples; the value of each metabolite was obtained from the average of triplicates and the level of each metabolite in resting WT T cells was set to 1. The heat map represents the log2 value of the relative level of each metabolite, which was grouped in the indicated metabolic pathway (see color scale). The complete metabolomic profile is provided in Table S6. (F–H) The experimental procedure (F) used for the SEB superantigen challenge model. Myc flox/flox mice (WT) or RosaCreERTam-Mycflox/flox mice (KO) were treated with tamoxifen (i.p. 1mg/mouse for three days), and then were injected with SEB (i.v. 100μg/mouse). The percentage (G) and the cell size (H) of Vβ8+ T cells were determined two days after injection of SEB.
Figure 5
Figure 5. Myc drives a transcription program that regulates glucose catabolism upon T cell activation
(A) Glycolytic flux as determined by the generation of 3H2O from [3-3H]-glucose. (B) qPCR analyses of metabolic genes. mRNA levels in resting WT T cells were set to 1. The heat map represents the log2 value of the relative mRNA expression level (see color scale). Values and standard deviations are provided in Table S5. Data are representative of two independent experiments, performed in triplicate. (C–D) Naïve CD4+Vβ8+ T cells (R) were sorted from mice without SEB immunization; WT and acutely Myc-deleted CD4+Vβ8+ T cells (KO) were isolated from mice two days after SEB immunization (Fig. 4F). Glycolysis (C) and mRNA expression (D and Table S5) in the indicated groups were determined by the generation of 3H2O from [3-3H]-glucose and qPCR. (E–F) PPP flux (E) and pyruvate oxidation through the TCA cycle (F) were determined by the generation of 14CO2 from [1-14C]-glucose and from [2-14C]-pyruvate, respectively.
Figure 6
Figure 6. Myc drives a transcriptional program coupling glutaminolysis to biosynthetic pathways
(A) Rates of glutaminolysis, determined by the generation of 14CO2 from [U-14C]-glutamine. Data are representative of two independent experiments. (B) qPCR analyses of metabolic genes. mRNA levels in resting WT T cells were set to 1. The heat map represents the log2 value of the relative mRNA expression level (see color scale). Values and standard deviations are provided in Table S5. Data are representative of two independent experiments. (C) Cell surface expression of CD98 was determined by flow cytometry. (D) Protein levels of Gls2 and p53 were determined by immunoblot. The asterisk indicates a non-specific band. (E) Glutaminolytic flux was determined by the generation of 14CO2 from [U-14C]-glutamine. (F) Cell proliferation of active T cells (48hr), treated with vehicle (Ctr), with 1mM DFMO (Inh) or with 1mM DFMO plus polyamine mixture (Inh/PAs), determined by CFSE dilution. The composition and concentration of polyamine mixture are provided in Table S7. (G) T cells were collected at 72hr after activation in glutamine free media (Q−), in glutamine free media supplemented with 2μM α-KG (Q−/αKG), in glutamine free media supplemented with 2μM α-KG and 100μM hypoxanthine and 16μM thymidine (Q−/αKG/HT) or in glutamine free media supplemented with 2μM α-KG and polyamine mixture (Q−/αKG/PAs). The composition and concentration of the polyamine mixture is provided in Table S7. Cell proliferation was determined as CFSE dilution by flow cytometry.
Figure 7
Figure 7. Myc-driven glutaminolysis fuels polyamine biosynthesis upon T cell activation
(A) Arginase I WT and KO T cells were collected 48hr after activation (Act/WT and Act/KO, respectively). Cell proliferation was determined by CFSE dilution. (B) WT and arginase I KO active T cells were analyzed by qPCR for arginase I mRNA expression. (C) (Upper panel) Potential metabolic steps linked to the polyamine biosynthetic pathway, with metabolic genes measured highlighted in blue. (Lower panel) WT and Myc KO T cells were collected at the indicated times after activation and qPCR analyses of metabolic genes was performed. mRNA levels in resting T cells were set to 1. The heat map represents the log2 value of the relative mRNA expression level (see color scale). Values and standard deviations are provided in Table S5. Data are representative of two independent experiments, performed in triplicate. (D) T cells were cultured in media containing U-13C-glutamine and collected at the indicated times after activation. The intracellular levels of ornithine and putrescine including U-13C- and 12C-labeled forms were determined by mass spectroscopy. (E) Myc-dependent metabolic reprogramming upon T cell activation, with upregulated metabolic pathways highlighted in red, downregulated metabolic pathways highlighted in black and Myc-dependent metabolic genes highlighted in blue.

Comment in

  • T cell Myc-tabolism.
    Rathmell JC. Rathmell JC. Immunity. 2011 Dec 23;35(6):845-6. doi: 10.1016/j.immuni.2011.12.001. Immunity. 2011. PMID: 22195738 Free PMC article.

Similar articles

Cited by

References

    1. Araki K, Turner AP, Shaffer VO, Gangappa S, Keller SA, Bachmann MF, Larsen CP, Ahmed R. mTOR regulates memory CD8 T-cell differentiation. Nature. 2009;460:108–112. - PMC - PubMed
    1. Badea TC, Wang Y, Nathans J. A noninvasive genetic/pharmacologic strategy for visualizing cell morphology and clonal relationships in the mouse. J Neurosci. 2003;23:2314–2322. - PMC - PubMed
    1. Bello-Fernandez C, Packham G, Cleveland JL. The ornithine decarboxylase gene is a transcriptional target of c-Myc. Proc Natl Acad Sci U S A. 1993;90:7804–7808. - PMC - PubMed
    1. Bowlin TL, McKown BJ, Babcock GF, Sunkara PS. Intracellular polyamine biosynthesis is required for interleukin 2 responsiveness during lymphocyte mitogenesis. Cell Immunol. 1987;106:420–427. - PubMed
    1. Brand K, Williams JF, Weidemann MJ. Glucose and glutamine metabolism in rat thymocytes. Biochem J. 1984;221:471–475. - PMC - PubMed

Publication types

MeSH terms