. 2011 Dec 15;124(Pt 24):4267-85.
doi: 10.1242/jcs.091231. Epub 2011 Dec 22.

SMRT analysis of MTOC and nuclear positioning reveals the role of EB1 and LIC1 in single-cell polarization

Affiliations

SMRT analysis of MTOC and nuclear positioning reveals the role of EB1 and LIC1 in single-cell polarization

Christopher M Hale et al. J Cell Sci. .

Abstract

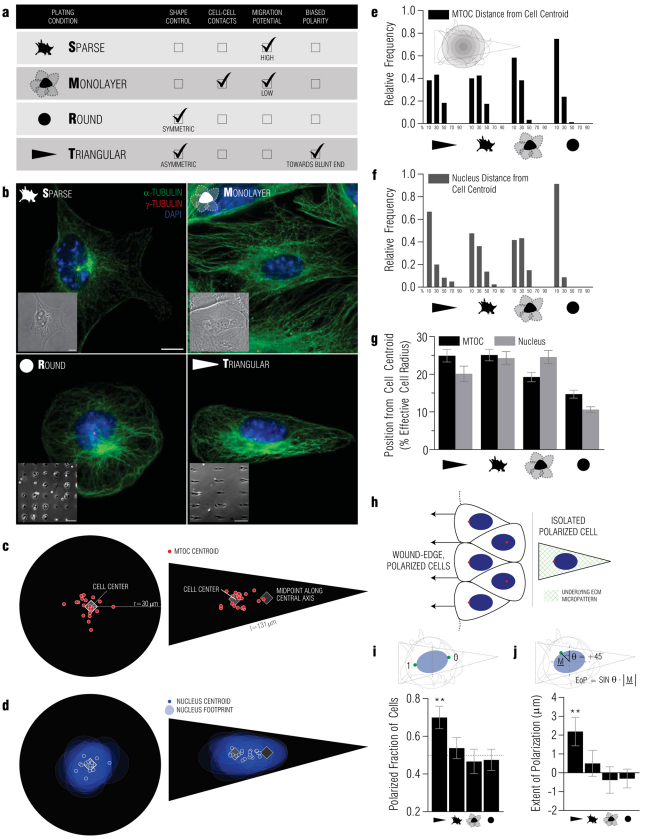
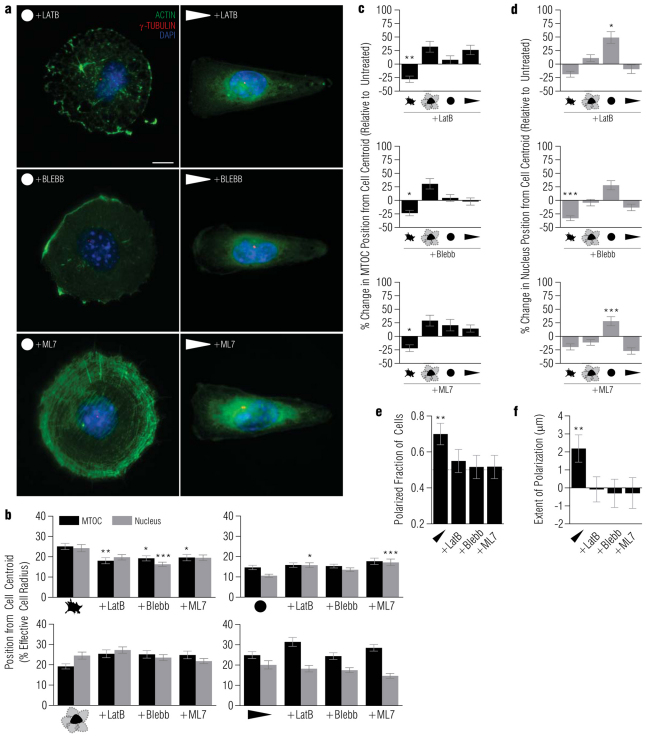
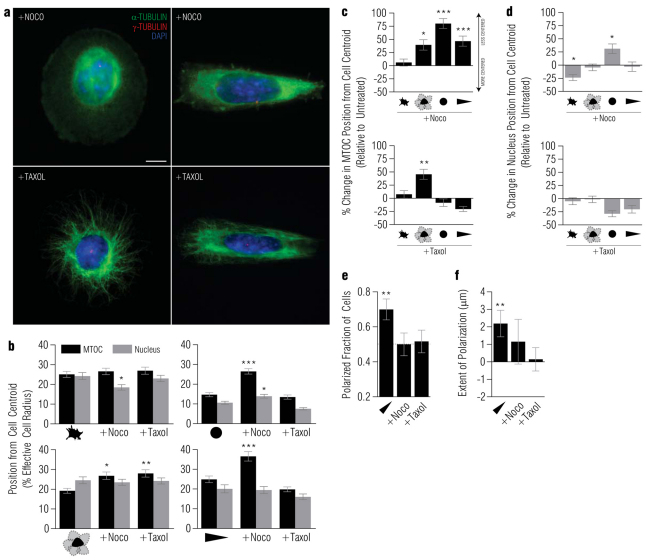
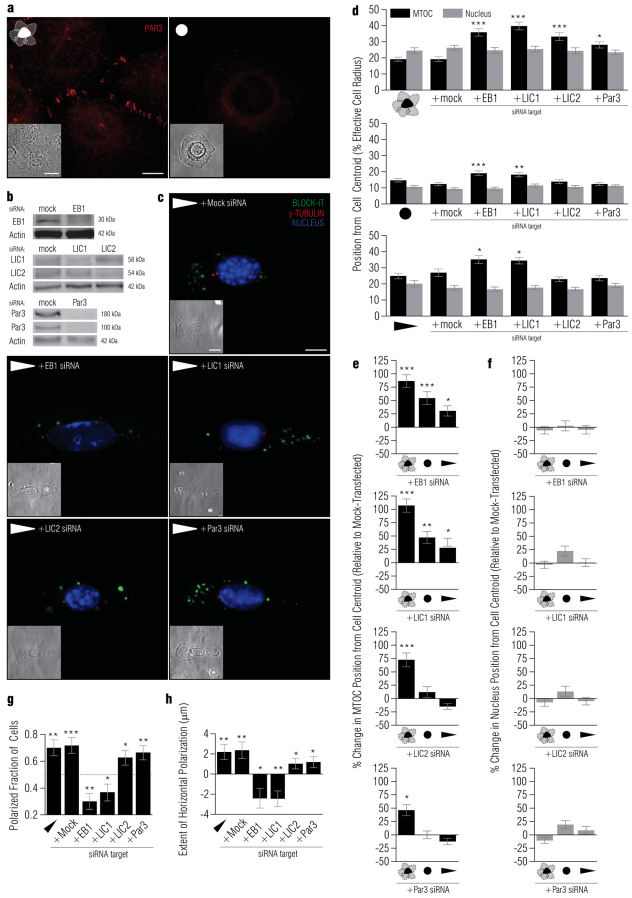
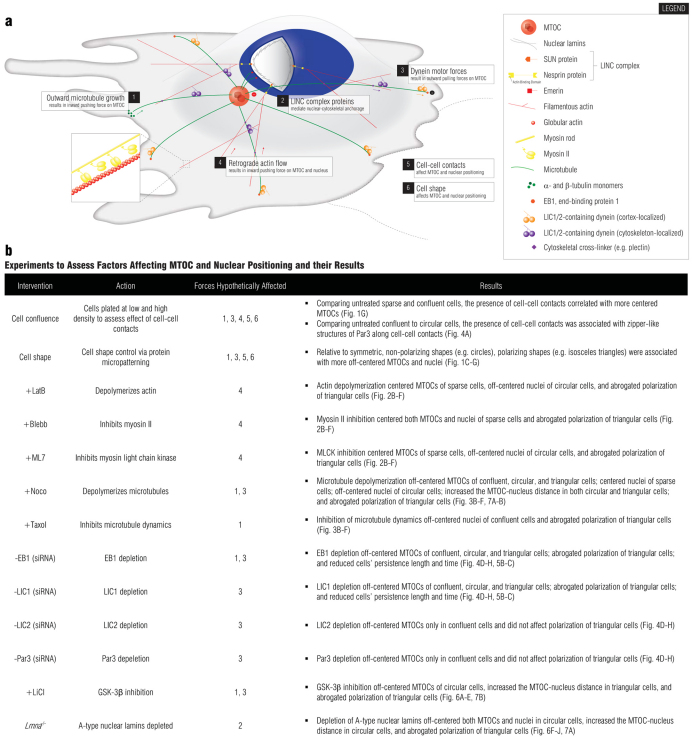
In several migratory cells, the microtubule-organizing center (MTOC) is repositioned between the leading edge and nucleus, creating a polarized morphology. Although our understanding of polarization has progressed as a result of various scratch-wound and cell migration studies, variations in culture conditions required for such assays have prevented a unified understanding of the intricacies of MTOC and nucleus positioning that result in cell polarization. Here, we employ a new SMRT (for sparse, monolayer, round, triangular) analysis that uses a universal coordinate system based on cell centroid to examine the pathways regulating MTOC and nuclear positions in cells plated in a variety of conditions. We find that MTOC and nucleus positioning are crucially and independently affected by cell shape and confluence; MTOC off-centering correlates with the polarization of single cells; acto-myosin contractility and microtubule dynamics are required for single-cell polarization; and end binding protein 1 and light intermediate chain 1, but not Par3 and light intermediate chain 2, are required for single-cell polarization and directional cell motility. Using various cellular geometries and conditions, we implement a systematic and reproducible approach to identify regulators of MTOC and nucleus positioning that depend on extracellular guidance cues.


Figures

Fig. 1.
Fig. 1.
Positions of MTOC and nucleus depend on cellular shape and confluence. (a) SMRT (sparse, monolayer, round and triangular) conditions in which cells were plated to vary factors thought to affect MTOC and nucleus positioning. (b) Immunofluorescence of microtubules (green), microtubule-organizing center (MTOC, red) and the nucleus (blue) in SMRT conditions. Scale bar: 10 μm. Insets: Phase contrast images of sparse (top left) and confluent cells (top right) at high-magnification. Scale bars: 10 μm. Low-magnification phase-contrast images show confinement of cells to circular (bottom left) and triangular (bottom right) micropatterns. Scale bars: 100 μm. (c,d) Actual MTOC (c) and nucleus (d) centroids in 20 randomly chosen cells overlaid on circular (left) and triangular (right) masks upon which cells were confined. (e) Frequency distribution of the distance of the MTOC from the cell centroid in triangular, sparse, confluent and circular cells. Cellular area was divided into five regions of equal radius such that the first bin centered at 10% represents the number of cells whose MTOCs were located within 20% of an effective radius of the cell (~6 μm for a circular cell) from the cell centroid (n≥60 cells for each condition). (f) Frequency distribution of the distance of the nucleus from the cell centroid in triangular, sparse, confluent and circular cells (n≥60 cells for each condition). (g) Average distances of the MTOC (black) and nucleus (gray) from the cell centroid in triangular, sparse, confluent and circular cells (n≥60 cells for each condition). (h) Diagrams of two in vitro polarization assays, the scratch-wound assay (left) and the single-cell micropatterning polarization assay (right). Note that wound-edge cells and the single cell are polarized as indicated by the forward position of the MTOC (red) relative to the nucleus (blue). (i) Fractions of cells that were polarized in polarized triangular, sparse, confluent, and circular cells assessed in a binary fashion such that MTOCs located to the left of the nucleus were scored as polarized and received a score of 1, whereas MTOCs located to the right of the nucleus were scored as unpolarized and received a score of 0, according to the ability of the triangular-shaped micropattern to polarize cells towards their blunt end (Jiang et al., 2005) (n≥60 cells for each condition). (j) Extents of polarization of triangular, sparse, confluent and circular cells. Asterisks in i and j indicate that a population is significantly (P<0.01) polarized, compared to unpolarized population-based theoretical means of 0.5 and 0.0, respectively, using a one-sample t-test (n≥60 cells for each condition).
Fig. 2.
Fig. 2.
Actin- and myosin-mediated MTOC and nucleus positioning depend on cell shape and confluence. (a) Immunofluorescence of actin (green), MTOC (red) and the nucleus (blue) in latrunculin B-treated circular (top left) and triangular cells (top right), blebbistatin-treated circular (middle left) and triangular cells (middle right) and ML-7-treated circular (bottom left) and triangular cells (bottom right). Scale bar: 10 μm. (b) Average MTOC (black) and nucleus (gray) distances from the cell centroid in untreated, latrunculin-B-treated, blebbistatin-treated and ML-7-treated SMRT conditions (n≥60 cells for each condition). (c,d) Percentage change in the distance of the in MTOC (c) and nucleus (d) from the cell centroid upon latrunculin B (top), blebbistatin (middle) and ML-7 treatment (bottom), relative to untreated cells in SMRT conditions (n≥60 cells for each condition). (e) Fractions of cells that were polarized in untreated, latrunculin-B-, blebbistatin- and ML-7-treated cells plated on triangular micropatterns (n≥60 cells for each condition). (f) Extents of polarization of untreated, latrunculin-B-, blebbistatin- and ML-7-treated cells plated on triangular micropatterns (n≥60 cells for each condition). *P<0.05; **P<0.01; ***P<0.001.
Fig. 3.
Fig. 3.
Microtubule-mediated MTOC and nucleus positioning depends on cell shape and confluence. (a) Immunofluorescence of microtubules (green), MTOC (red) and the nucleus (blue) in nocodazole-treated circular (top left) and triangular cells (top right) and Taxol-treated circular (bottom left) and triangular cells (bottom right). Scale bar: 10 μm. (b) Average distance of the MTOC (black) and the nucleus (gray) from cell centroid in untreated, nocodazole-treated and Taxol-treated SMRT conditions. Asterisks indicate significant differences (*P<0.05; **P<0.01; ***P<0.001) between the indicated population and untreated cells using a one-way ANOVA followed by Dunnett's multiple comparison test (n≥60 cells for each condition). (c,d) Percentage change in the distance of the MTOC (c) and the nucleus (d) from the cell centroid upon nocodazole (top) and Taxol treatment (bottom) relative to untreated cells in SMRT conditions (n≥60 cells for each condition). (e) Fractions of cells that were polarized in untreated, nocodazole- and Taxol-treated cells plated on triangular micropatterns (n≥60 cells for each condition). (f) Extents of polarization of untreated, nocodazole- and Taxol-treated cells plated on triangular micropatterns (n≥60 cells for each condition).
Fig. 4.
Fig. 4.
EB1, LIC1 and 2 and Par3 regulate MTOC and nuclear positioning in a cell-confluence-dependent manner. (a) Immunofluorescence of Par3 (red) in confluent cells (left) and an isolated, circular cell (right). Note the zipper-like structures that form at cell–cell contacts in confluent cells, and the absence of these structures at the cell periphery in the isolated circular cell. Scale bar: 10 μm. Insets: corresponding phase-contrast images of confluent cells (left) and an isolated, circular cell (right). Scale bar: 20 μm. (b) Immunoblots of EB1 and actin (loading control) from MEFs transfected with EB1 and mock siRNAs (top); immunoblots of LIC1, LIC2 and actin from MEFs transfected with LIC1, LIC2 and mock siRNAs (middle); immunoblots of Par3 and actin from MEFs transfected with Par3 and mock siRNAs (bottom). (c) Immunofluorescence of Block-iT Fluorescent Oligo (green), MTOC (red) and DRAQ5- or DAPI-stained nuclei (blue) in siRNA-transfected cells on triangular micropatterns. Scale bar: 10 μm. Insets: corresponding phase-contrast images (bottom left). Scale bar: 20 μm. (d) Average distance of the MTOC (black) and nucleus (gray) from the cell centroid in fibroblasts transfected with mock siRNA and siRNA targeted at EB1, LIC1, LIC2 and Par3. Results are shown for confluent (top), circular (middle) and triangular cells (bottom; n≥60 cells for each condition). (e,f) Percent change in the distance of the MTOC (e) and nucleus (f) from the cell centroid in EB1- (top), LIC1- (top middle), LIC2- (bottom middle) and Par3-siRNA-treated cells (bottom) relative to mock-siRNA treated cells in confluent, circular and triangular conditions (n≥60 cells for each condition). (g) Fraction of cells that were polarized in untreated, mock-, EB1-, LIC1-, LIC2- and Par3-siRNA-treated cells plated on triangular micropatterns (n≥60 cells for each condition). (h) Extents of polarization of untreated, mock-, EB1-, LIC1-, LIC2- and Par3-siRNA-treated cells plated on triangular micropatterns (n≥60 cells for each condition).
Fig. 5.
Fig. 5.
EB1 or LIC1 depletion impairs directional cell motility. (a) Immunofluorescence of EB1 (green) and the nucleus (blue) in confluent (top) and triangular (bottom) cells. Scale bar: 10 μm. Insets: corresponding phase-contrast images (bottom left). Scale bar: 20 μm. (b) Immunofluorescence of LIC1 (green) and the nucleus (blue) in confluent (top) and triangular (bottom) cells. Scale bar: 10 μm. Insets: corresponding phase-contrast images (bottom left). Scale bar: 20 μm. (c,d) Persistence length (c) and time (d) during the migration of single MEFs transfected with mock, EB1, LIC1, Par3 and LIC2 siRNAs (n=15 cells for each condition).
Fig. 6.
Fig. 6.
GSK-3β and A-type lamins in MTOC and nucleus positioning. (a) Average distances of the MTOC (black) and nucleus (gray) from cell centroid in untreated and LiCl-treated circular (top) and triangular (bottom) cells. Asterisks indicate significant differences between LiCl-treated and untreated cells using a one-way ANOVA followed by Dunnett's multiple comparison test (n≥60 cells for each condition). (b,c) Percent change in the distances of the MTOC (b) and nucleus (c) from the cell centroid upon LiCl treatment relative to that in untreated circular and triangular cells. Asterisks indicate significant differences between LiCl-treated and untreated cells using a one-way ANOVA followed by Dunnett's multiple comparison test (n≥60 cells for each condition). (d) Fractions of cells that were polarized in untreated and LiCl-treated cells plated on triangular micropatterns. Asterisks indicate that a population is significantly polarized compared with an unpolarized population-based theoretical mean of 0.5, using a one sample t-test (n≥60 cells for each condition). (e) Extents of polarization of untreated and LiCl-treated cells plated on triangular micropatterns. Asterisks indicate that a population is significantly polarized, compared with an unpolarized population-based theoretical mean of 0.0 using a one-sample t-test (n≥60 cells for each condition). (f) Average distances of the MTOC (black) and nucleus (gray) from the cell centroid in wild-type and Lmna−/− circular (top) and triangular MEFs (bottom). Asterisks indicate significant differences between Lmna−/− and wild-type fibroblasts using a one-way ANOVA followed by Dunnett's multiple comparison test (n≥60 cells for each condition). (g,h) Percentage change in the distances of the MTOC (g) and nucleus (h) from the cell centroid in Lmna−/− fibroblasts relative to wild-type circular and triangular fibroblasts. Asterisks indicate significant differences between Lmna−/− and wild-type fibroblasts using a one-way ANOVA followed by Dunnett's multiple comparison test (n≥60 cells for each condition). (i) Fractions of wild-type and Lmna−/− fibroblasts that were polarized after plated on triangular micropatterns. Asterisks indicate that wild-type fibroblasts were significantly polarized, compared with an unpolarized population-based theoretical mean of 0.5, using a one sample t-test (n≥60 cells for each condition). (j) Extents of polarization of wild-type and Lmna−/− fibroblasts plated on triangular micropatterns. Asterisks indicate that a population is significantly polarized, compared with an unpolarized population-based theoretical mean of 0.0 using a one-sample t-test (n≥60 cells for each condition).
Fig. 7.
Fig. 7.
Importance of the MTOC–nucleus connection. (a,b) MTOC–nucleus distance, defined as the distance between the nuclear rim and the MTOC centroid, in circular (a) and triangular (b) fibroblasts for several conditions. Asterisks indicate significant differences between indicated population and untreated cells, using a one-way ANOVA followed by Dunnett's multiple comparison test. Arrows indicate specific conditions described in c (n≥60 cells for each condition). (c) A simplified diagram showing the effects of nocodazole treatment, latrunculin B treatment and loss of A-type lamins on MTOC and nucleus positioning in circular fibroblasts. Top: in an untreated, wild-type fibroblast, three main connections are intact within the cell that function to position the MTOC and nucleus: (1) microtubules (green) connect the MTOC to the plasma membrane; (2) actin connects the nucleus to the plasma membrane; and (3) short microtubule tethers connect the MTOC and nucleus. Bottom: upon microtubule depolymerization, the first and third connections are eliminated, causing a very significant increase in the MTOC–cell centroid distance, a significant increase in the nucleus–cell centroid distance and a significant increase in the MTOC–nucleus distance. Note that positional changes are exaggerated slightly to allow easier visualization of trends. Upon actin depolymerization, only the second connection is eliminated, causing no significant change in the MTOC–cell centroid distance, a significant increase in the nucleus–cell centroid distance, and a subtle, though non-significant, increase in the MTOC–nucleus distance. Upon loss of A-type lamins in Lmna−/− fibroblasts, the third connection is compromised, causing a significant increase in the MTOC–cell centroid distance, a very significant increase in the nucleus–cell centroid distance and a very significant increase in the MTOC–nucleus distance. Taken together, these results demonstrate the importance of nucleo-cytoskeletal connections in regulating the position of both the MTOC and nucleus.
Fig. 8.
Fig. 8.
Forces and cellular conditions that affect MTOC and nuclear positioning. (a) A cartoon of the primary and hypothesized forces acting on the MTOC and nucleus to regulate their position. (b) Design and results of experiments performed using drugs, siRNA and gene knockouts to manipulate specific forces acting on the MTOC and nucleus.

Similar articles

Cited by

References

    1. Bacallao R., Antony C., Dotti C., Karsenti E., Stelzer E. H., Simons K. (1989). The subcellular organization of Madin-Darby canine kidney cells during the formation of a polarized epithelium. J. Cell Biol. 109, 2817-2832 - PMC - PubMed
    1. Bajpai S., Correia J., Feng Y., Figueiredo J., Sun S. X., Longmore G. D., Suriano G., Wirtz D. (2008). {alpha}-Catenin mediates initial E-cadherin-dependent cell-cell recognition and subsequent bond strengthening. Proc. Natl. Acad. Sci. USA 105, 18331-18336 - PMC - PubMed
    1. Bergmann J. E., Kupfer A., Singer S. J. (1983). Membrane insertion at the leading edge of motile fibroblasts. Proc. Natl. Acad. Sci. USA 80, 1367-1371 - PMC - PubMed
    1. Berzat A., Hall A. (2010). Cellular responses to extracellular guidance cues. EMBO J. 29, 2734-2745 - PMC - PubMed
    1. Bornens M. (2008). Organelle positioning and cell polarity. Nat. Rev. Mol. Cell Biol. 9, 874-886 - PubMed

Publication types

MeSH terms