Cellulose synthase interactive protein 1 (CSI1) links microtubules and cellulose synthase complexes
- PMID: 22190487
- PMCID: PMC3252916
- DOI: 10.1073/pnas.1118560109
Cellulose synthase interactive protein 1 (CSI1) links microtubules and cellulose synthase complexes
Abstract
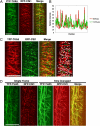
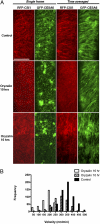
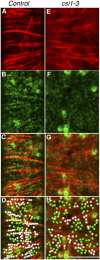
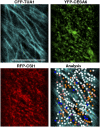
Cellulose synthase (CESA) complexes can be observed by live-cell imaging to move with trajectories that parallel the underlying cortical microtubules. Here we report that CESA interactive protein 1 (CSI1) is a microtubule-associated protein that bridges CESA complexes and cortical microtubules. Simultaneous in vivo imaging of CSI1, CESA complexes, and microtubules demonstrates that the association of CESA complexes and cortical microtubules is dependent on CSI1. CSI1 directly binds to microtubules as demonstrated by in vitro microtubule-binding assay.
Conflict of interest statement
The authors declare no conflict of interest.
Figures


Similar articles
-
CESA TRAFFICKING INHIBITOR inhibits cellulose deposition and interferes with the trafficking of cellulose synthase complexes and their associated proteins KORRIGAN1 and POM2/CELLULOSE SYNTHASE INTERACTIVE PROTEIN1.Plant Physiol. 2015 Feb;167(2):381-93. doi: 10.1104/pp.114.249003. Epub 2014 Dec 22. Plant Physiol. 2015. PMID: 25535279 Free PMC article.
-
Cellulose synthase interactive protein 1 (CSI1) mediates the intimate relationship between cellulose microfibrils and cortical microtubules.Plant Signal Behav. 2012 Jul;7(7):714-8. doi: 10.4161/psb.20338. Epub 2012 Jul 1. Plant Signal Behav. 2012. PMID: 22751327 Free PMC article.
-
Identification of a cellulose synthase-associated protein required for cellulose biosynthesis.Proc Natl Acad Sci U S A. 2010 Jul 20;107(29):12866-71. doi: 10.1073/pnas.1007092107. Epub 2010 Jul 1. Proc Natl Acad Sci U S A. 2010. PMID: 20616083 Free PMC article.
-
Making parallel lines meet: transferring information from microtubules to extracellular matrix.Cell Adh Migr. 2012 Sep-Oct;6(5):404-8. doi: 10.4161/cam.21121. Epub 2012 Aug 20. Cell Adh Migr. 2012. PMID: 22902763 Free PMC article. Review.
-
Cellulose synthase interacting protein: a new factor in cellulose synthesis.Plant Signal Behav. 2010 Dec;5(12):1571-4. doi: 10.4161/psb.5.12.13621. Epub 2010 Dec 1. Plant Signal Behav. 2010. PMID: 21150290 Free PMC article. Review.
Cited by
-
A small molecule inhibits cell elongation by modulating cell wall polysaccharide composition in Arabidopsis.Cell Surf. 2021 Feb 2;7:100049. doi: 10.1016/j.tcsw.2021.100049. eCollection 2021 Dec. Cell Surf. 2021. PMID: 33665521 Free PMC article.
-
What can plants do for cell biology?Mol Biol Cell. 2013 Aug;24(16):2491-3. doi: 10.1091/mbc.E12-10-0706. Mol Biol Cell. 2013. PMID: 23943803 Free PMC article.
-
F-Actin Organization and Epidermal Cell Morphogenesis in the Brown Alga Sargassum vulgare.Int J Mol Sci. 2023 Aug 26;24(17):13234. doi: 10.3390/ijms241713234. Int J Mol Sci. 2023. PMID: 37686039 Free PMC article.
-
Plant cell shape: modulators and measurements.Front Plant Sci. 2013 Nov 19;4:439. doi: 10.3389/fpls.2013.00439. Front Plant Sci. 2013. PMID: 24312104 Free PMC article. Review.
-
The Arabidopsis COBRA protein facilitates cellulose crystallization at the plasma membrane.J Biol Chem. 2014 Dec 12;289(50):34911-20. doi: 10.1074/jbc.M114.607192. Epub 2014 Oct 20. J Biol Chem. 2014. Retraction in: J Biol Chem. 2015 Oct 16;290(42):25274. doi: 10.1074/jbc.A114.607192 PMID: 25331944 Free PMC article. Retracted.
References
-
- Green PB. Mechanism for plant cellular morphogenesis. Science. 1962;138:1404–1405. - PubMed
-
- Baskin TI. On the alignment of cellulose microfibrils by cortical microtubules: A review and a model. Protoplasma. 2001;215:150–171. - PubMed
-
- Giddings TH, Staehelin LA. Microtubule-mediated control of microfibril deposition: A re-examination of the hypothesis. In: Lloyd CW, editor. The Cytoskeletal Basis of Plant Growth and Form. London: Academic; 1991. pp. 85–99.
-
- Heath IB. A unified hypothesis for the role of membrane bound enzyme complexes and microtubules in plant cell wall synthesis. J Theor Biol. 1974;48:445–449. - PubMed
Publication types
MeSH terms
Substances
LinkOut - more resources
Full Text Sources
Other Literature Sources
Molecular Biology Databases
Research Materials

