. 2012 Apr;40(8):3443-55.
doi: 10.1093/nar/gkr1234. Epub 2011 Dec 20.

Concerted nicking of donor and chromosomal acceptor DNA promotes homology-directed gene targeting in human cells

Affiliations

Concerted nicking of donor and chromosomal acceptor DNA promotes homology-directed gene targeting in human cells

Manuel A F V Gonçalves et al. Nucleic Acids Res. 2012 Apr.

Abstract

The exchange of genetic information between donor and acceptor DNA molecules by homologous recombination (HR) depends on the cleavage of phosphodiester bonds. Although double-stranded and single-stranded DNA breaks (SSBs) have both been invoked as triggers of HR, until very recently the focus has been primarily on the former type of DNA lesions mainly due to the paucity of SSB-based recombination models. Here, to investigate the role of nicked DNA molecules as HR-initiating substrates in human somatic cells, we devised a homology-directed gene targeting system based on exogenous donor and chromosomal target DNA containing recognition sequences for the adeno-associated virus sequence- and strand-specific endonucleases Rep78 and Rep68. We found that HR is greatly fostered if a SSB is not only introduced in the chromosomal acceptor but also in the donor DNA template. Our data are consistent with HR models postulating the occurrence of SSBs or single-stranded gaps in both donor and acceptor molecules during the genetic exchange process. These findings can guide the development of improved HR-based genome editing strategies in which sequence- and strand-specific endonucleolytic cleavage of the chromosomal target site is combined with that of the targeting vector.


Figures
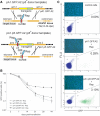
Figure 1.
Figure 1.
Stable genetic modification of human cells with p5-negative or -positive targeting vectors containing DNA sequences homologous to the genomic region framing the RBE and trs at AAVS1. (A) Experimental setup deployed to investigate the role of sequence- and strand-specific cleavage of donor and acceptor DNA molecules on mitotic HR at an endogenous human locus. The donor template pA1.GFP.A2 differs from pA1.p5.GFP.A2 by lacking p5. Both targeting constructs contain a 4.1-kb transcription unit consisting of the EF1α promoter (large yellow box), the GFP ORF (green box) and the SV40 pA signal (small yellow box). Immediately upstream of the EF1α promoter in pA1.p5.GFP.A2 lies the nicking-competent p5 element, whose RBE and trs are indicated by a red bar and vertical thin black line, respectively. The GFP gene in both donor plasmids is bracketed by DNA segments homologous to those framing the trs (vertical thin black line) and RBE (red box) at the chromosomal target site (i.e. the AAVS1 locus embedded in the PPP1R12C gene at 19q13.42-qter). The arbitrarily designated homology ‘arms’ 1 and 2 (thick yellow lines) are 2063 and 4381 bps in length, respectively. The AAV endonucleases Rep78 and Rep68 are represented by a cyan oval. (B) Flow cytometric quantification of the frequency of GFP-positive HeLa cells at different times after co-transfection with pA1.GFP.A2 or pA1.p5.GFP.A2 and either the AAV rep78/68 expression plasmid pGAPDH.Rep78/68 (+Rep) or an ‘empty’ control vector (−Rep). The frequencies of GFP-positive cells at the different time points in each of the experimental groups are plotted relative to those measured at 2 days post-transfection. Bars represent means ± SD of three independent experiments. (C) Representative flow cytometry dot plots corresponding to untransfected HeLa cells (control cells) and to HeLa cells initially co-transfected with pA1.GFP.A2 and pGAPDH.Rep78/68 (pA1.GFP.A2 + Rep) or with pA1.p5.GFP.A2 and pGAPDH.Rep78/68 (pA1.p5.GFP.A2 + Rep) at 44 days post-transfection. The frequency of stably transfected cells in each of the cell populations is indicated. The insets show direct fluorescence micrographs of each of the three types of HeLa cell populations. The GFP-specific signals (green) are overlaid with those of the DNA-binding dye Hoechst 33342 (blue).
Figure 2.
Figure 2.
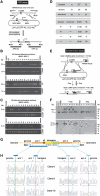
Detection of homology-directed gene targeting events. (A) Diagram of the PCR assay deployed to identify cells genetically modified through HR-mediated GFP gene addition. The primer pairs #649/#651 and #650/#635 allow the detection of HR events at the AAVS1 of human cells transfected with the targeting construct pA1.p5.GFP.A2 by yielding diagnostic 2868-bp and 5361-bp PCR amplicons, respectively (horizontal black bars). Half arrows, primers #649, #651, #650 and #635 drawn in relation to their respective target sequences; thin black line, AAVS1 chromosomal region; horizontal thick grey lines, sequences shared by target and donor DNA; grey bar and vertical black line, RBE and trs, respectively; black box, nicking-prone p5 element; open box with broken arrow, EF1α promoter; large grey box, GFP ORF; open box, SV40 pA signal; open circle, prokaryotic origin of DNA replication. (B) PCR screening of clones derived from stably transfected HeLa cell populations initially co-transfected with pA1.p5.GFP.A2 and pGAPDH.Rep78/68. The panels labeled GT display the results of amplification reactions carried out with primers #649 and #651. PCR amplification of a 1.9-kb segment of the hypoxanthine phosphoribosyltransferase 1 gene (HPRT1) was performed in parallel to ascertain the integrity of the various genomic DNA templates (panels marked HPRT1). Marker, Gene Ruler DNA Ladder Mix (Fermentas); H20, PCR performed with nuclease-free water instead of chromosomal DNA. The positions (arrowheads) and sizes (in kb) of the PCR products are indicated at the left. (C) PCR screening of clones derived from stably transfected HeLa cell populations originally co-transfected with pA1.p5.GFP.A2 and pGAPDH.Rep78/68. The panels marked GT correspond to the PCR assay performed with primers #650 and #635 whereas those labeled HPRT1 are for the purpose specified in the legend of Figure 2B. (D) Summary of the data presented in Figure 2B and 2C, which resulted from the PCR assays depicted in Figure 2A. (E) Schematic representation of the Southern blot assay with ApaLI-digested genomic DNA from randomly selected clones of pA1.p5.GFP.A2-transfected HeLa cells. Unmodified target loci should yield a 7.1-kb AAVS1-specific restriction fragment while ‘two-sided’ HR should give rise to a DNA species of 10.1 kb hybridizing to the AAVS1- as well as the GFP-specific probe (black horizontal bars). Both probes are drawn in relation to their respective target DNA sequences. For an explanation of the other elements and symbols see the legend of Figure 2A. (F) Southern blots of ApaLI-treated genomic DNA of untransfected HeLa cells (HeLa) and of HeLa cell clones derived from cultures co-transfected with pA1.p5.GFP.A2 and pGAPDH.Rep78/68 (+Rep) or with pA1.p5.GFP.A2 and ‘empty’ plasmid (−Rep). The 12.9-kb ApaLI-linearized pA1.p5.GFP.A2 DNA (donor) served as an internal reference. Marker, Gene Ruler DNA Ladder Mix (Fermentas). (G) Diagram of the GFP expression unit (yellow and green boxes) inserted at 19q13.42-qter (horizontal yellow lines) upon homology-directed gene targeting deploying pA1.p5.GFP.A2 as donor template. Primers used to amplify the left- and right-hand junctions (dark and light blue half arrows, respectively) are drawn in relation to their recognition sequences. The 2.9- and 5.4-kb PCR amplicons specific for ‘telomeric’ and ‘centromeric’ DNA junctions are indicated by dark and light blue bars, respectively. (H) Nucleotide sequence analysis of ‘telomeric’ and ‘centromeric’ junctions between endogenous and exogenous DNA resulting from Rep78/68-induced HR events. The nucleotide sequences of the transition regions between pA1.p5.GFP.A2 sequences and flanking genomic or transgene DNA for three different clones that underwent HR are shown.
Figure 3.
Figure 3.
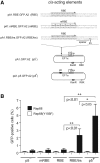
Stable genetic modification of human cells with AAVS1-targeting vectors containing minimal AAV Rep endonuclease recognition sequences. (A) Structures of the p5-negative pA1.GFP.A2 and the p5-positive pA1.p5.GFP.A2 donor constructs and of the targeting plasmids pA1.RBE.GFP.A2, pA1.mRBE.GFP.A2 and pA1.RBE/trs.GFP.A2 harboring the minimal AAV Rep endonuclease recognition sites RBE, mutant RBE (mRBE) and RBE/trs, respectively. The nucleotide sequence corresponding to the wild-type RBE is shown in black uppercase letters whereas the trs (i.e. the position at which Rep78/68-mediated nicking takes place) is indicated by black lowercase letters and a vertical arrow. The DNA sequence between the RBE and the trs is dubbed the spacer. The nucleotide sequence of the mRBE contains guanines (shown in lowercase and marked with asterisks) in place of cytosines. R6K, prokaryotic origin of DNA replication; KanR, transposon Tn5 neomycin phosphotransferase II gene conferring resistance to kanamycin. For an explanation of the other symbols and elements see the legend of Figure 2A. (B) Stable transfection levels in cultures of Hela cells initially co-transfected with the targeting vector pA1.GFP.A2 (p5), pA1.mRBE.GFP.A2 (mRBE), pA1.RBE.GFP.A2 (RBE), pA1.RBE/trs.GFP.A2 (RBE/trs) or pA1.p5.GFP.A2 (p5+) and either pGAPDH.Rep68(Y156F) (white bars) or pGAPDH.Rep68 (black bars). Flow cytometric analysis of 104 viable cells per sample was performed at 37 days post-transfection. Results shown correspond to means ± SD from three independent experiments.
Figure 4.
Figure 4.
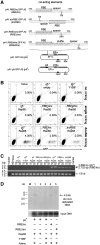
Effect of DNA sequences susceptible or unsusceptible to AAV Rep-mediated nicking on the stable transfection levels with AAVS1-targeting vectors. (A) Structures of the nicking-competent targeting plasmids pA1.p5.GFP.A2, pA1.RBE/trs.GFP.A2 and pA1.trs/RBE.GFP.A2 and that of the nicking-resistant donor constructs pA1.GFP.A2, pA1.RBE/Δtrs.GFP.A2 and pA1.RBEst/trs.GFP.A2. The nucleotide sequence corresponding to the wild-type RBE is shown in black uppercase letters whereas the trs (i.e. the position at which Rep78/68-mediated nicking takes place) is indicated by black lowercase letters and a vertical arrow. The DNA sequence between the RBE and the trs is called the spacer. Targeting plasmid pA1.RBE/Δtrs.GFP.A2 has the dinucleotide at which Rep endonuclease-mediated nicking occurs mutated from TT to AA while in pA1.RBE.st/trs.GFP.A2 a 21-bp stuffer positions the trs at a bigger distance from RBE-bound AAV Rep molecules. For an explanation of the other symbols and elements see the legend of Figure 3A. (B) Representative dot plots of flow cytometric analysis of the frequency of GFP-modified HeLa cells at 37 days post-transfection in cultures initially exposed to pA1.p5.GFP.A2 and ‘empty’ plasmid (p5++empty), pA1.p5.GFP.A2 and pGAPDH.Rep68(Y156F) (p5++Y156F), pA1.GFP.A2 and pGAPDH.Rep68 (p5+Rep68), pA1.RBE/Δtrs.GFP.A2 and pGAPDH.Rep68 (RBE/Δtrs+Rep68), pA1.RBEst/trs.GFP.A2 and pGAPDH.Rep68 (RBEst/trs+Rep68), pA1.p5.GFP.A2 and pGAPDH.Rep68 (p5++Rep68), pA1.RBE/trs.GFP.A2 and pGAPDH.Rep68 (RBE/trs+Rep68) or to pA1.trs/RBE.GFP.A2 and pGAPDH.Rep68 (trs/RBE+Rep68). Untransfected HeLa cells were used to set the background of the assay at 0.00% GFP-positive cells (HeLa). For each sample, 105 viable single cells were analyzed. (C) PCR analysis using primer set #649/#651 on chromosomal DNA extracted from untransfected HeLa cells (HeLa) and from HeLa cells co-transfected with pGAPDH.Rep68 (Rep68) and targeting constructs pA1.GFP.A2 (p5), pA1.RBE/Δtrs.GFP.A2 (RBE/Δtrs), pA1.RBEst/trs.GFP.A2 (RBEst/trs), pA1.p5.GFP.A2 (p5+), pA1.RBE/trs.GFP.A2 (RBE/trs) or pA1.trs/RBE.GFP.A2 (trs/RBE). HeLa cells were also co-transfected with pA1.p5.GFP.A2 (p5+) and pGAPDH.Rep68(Y156F) or with an ‘empty’ control plasmid (empty). The genomic DNA was isolated at 43 days post-transfection. HPRT1-specific PCRs served as control for the integrity of the input DNA. (D) In vivo nicking assay based on Southern blot analysis of DpnI-resistant extrachromosomal DNA. Episomal DNA was isolated at 4 days post-transfection from 911 cells co-transfected with pGAPDH.Rep68 and pA1.p5.GFP.A2 (lanes 1 and 2), pGAPDH.Rep68 and pA1.RBE/trs.GFP.A2 (lane 4) or pGAPDH.Rep68 and pA1.RBE/Δtrs.GFP.A2 (lane 5). Episomal DNA isolated from 911 cells co-transfected with pGAPDH.Rep68(Y156F) and pA1.p5.GFP.A2 (lane 3) served as a negative control. All cell cultures except for the one represented by lane 2 were exposed to Ad.floxedΨ.F50 at a multiplicity of infection of 25 infectious units per cell. Lane M, Gene Ruler DNA Ladder Mix. Prior to Southern blot analysis, the DNA was digested with DpnI (to fragment the input prokaryotic DNA) and with NcoI. Southern blots were exposed to a radiolabeled GFP-specific probe. The position of the 4.9-kb GFP-containing NcoI fragments derived from de novo synthesized DNA is indicated by an arrow at the right of the autoradiogram.
Figure 5.
Figure 5.
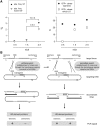
(A) Summary of the data resulting from the HR-specific PCR assay presented in a previous study (; values plotted in the leftward and middle columns [i.e. 0× nick and 1×nick, respectively]) and in the current work (values plotted in the rightward columns [i.e. 2× nick]). The results are shown in terms of the absolute frequencies of stably transfected (ST) cells (left graph, solid diamonds) and of AAVS1-targeted cells (left graph, open triangles) as well as in terms of the total numbers of reporter-positive clones analyzed (right graph, solid circles) and of those that were targeted at AAVS1 through HR (right graph, open squares). (B) Working model for nick-initiated mitotic HR in human cells (see text for details).

Similar articles

Cited by

References

    1. Kass EM, Jasin M. Collaboration and competition between DNA double-strand break repair pathways. FEBS Lett. 2010;584:3703–3708. - PMC - PubMed
    1. Holliday R. A mechanism for gene conversion in fungi. Genet. Res. 1964;5:282–304. - PubMed
    1. Meselson MS, Radding CM. A general model for genetic recombination. Proc. Natl Acad. Sci. USA. 1975;72:358–361. - PMC - PubMed
    1. Radding CM. Homologous pairing and strand exchange in genetic recombination. Annu. Rev. Genet. 1982;16:405–437. - PubMed
    1. Resnick MA. The repair of double-strand breaks in DNA; a model involving recombination. J. Theoret. Biol. 1976;59:97–106. - PubMed

Publication types