Skeletal muscle-specific expression of PGC-1α-b, an exercise-responsive isoform, increases exercise capacity and peak oxygen uptake
- PMID: 22174785
- PMCID: PMC3234261
- DOI: 10.1371/journal.pone.0028290
Skeletal muscle-specific expression of PGC-1α-b, an exercise-responsive isoform, increases exercise capacity and peak oxygen uptake
Abstract
Background: Maximal oxygen uptake (VO(2max)) predicts mortality and is associated with endurance performance. Trained subjects have a high VO(2max) due to a high cardiac output and high metabolic capacity of skeletal muscles. Peroxisome proliferator-activated receptor γ coactivator 1α (PGC-1α), a nuclear receptor coactivator, promotes mitochondrial biogenesis, a fiber-type switch to oxidative fibers, and angiogenesis in skeletal muscle. Because exercise training increases PGC-1α in skeletal muscle, PGC-1α-mediated changes may contribute to the improvement of exercise capacity and VO(2max). There are three isoforms of PGC-1α mRNA. PGC-1α-b protein, whose amino terminus is different from PGC-1α-a protein, is a predominant PGC-1α isoform in response to exercise. We investigated whether alterations of skeletal muscle metabolism by overexpression of PGC-1α-b in skeletal muscle, but not heart, would increase VO(2max) and exercise capacity.
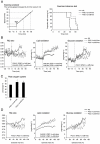
Methodology/principal findings: Transgenic mice showed overexpression of PGC-1α-b protein in skeletal muscle but not in heart. Overexpression of PGC-1α-b promoted mitochondrial biogenesis 4-fold, increased the expression of fatty acid transporters, enhanced angiogenesis in skeletal muscle 1.4 to 2.7-fold, and promoted exercise capacity (expressed by maximum speed) by 35% and peak oxygen uptake by 20%. Across a broad range of either the absolute exercise intensity, or the same relative exercise intensities, lipid oxidation was always higher in the transgenic mice than wild-type littermates, suggesting that lipid is the predominant fuel source for exercise in the transgenic mice. However, muscle glycogen usage during exercise was absent in the transgenic mice.
Conclusions/significance: Increased mitochondrial biogenesis, capillaries, and fatty acid transporters in skeletal muscles may contribute to improved exercise capacity via an increase in fatty acid utilization. Increases in PGC-1α-b protein or function might be a useful strategy for sedentary subjects to perform exercise efficiently, which would lead to prevention of life-style related diseases and increased lifespan.
Conflict of interest statement
Figures


Similar articles
-
Isoform-specific increases in murine skeletal muscle peroxisome proliferator-activated receptor-gamma coactivator-1alpha (PGC-1alpha) mRNA in response to beta2-adrenergic receptor activation and exercise.Endocrinology. 2008 Sep;149(9):4527-33. doi: 10.1210/en.2008-0466. Epub 2008 May 29. Endocrinology. 2008. PMID: 18511502
-
Skeletal Muscle-Specific Overexpression of PGC-1α Induces Fiber-Type Conversion through Enhanced Mitochondrial Respiration and Fatty Acid Oxidation in Mice and Pigs.Int J Biol Sci. 2017 Sep 5;13(9):1152-1162. doi: 10.7150/ijbs.20132. eCollection 2017. Int J Biol Sci. 2017. PMID: 29104506 Free PMC article.
-
Sirtuin 1 (SIRT1) deacetylase activity is not required for mitochondrial biogenesis or peroxisome proliferator-activated receptor-gamma coactivator-1alpha (PGC-1alpha) deacetylation following endurance exercise.J Biol Chem. 2011 Sep 2;286(35):30561-30570. doi: 10.1074/jbc.M111.261685. Epub 2011 Jul 11. J Biol Chem. 2011. PMID: 21757760 Free PMC article.
-
PGC-1alpha-induced improvements in skeletal muscle metabolism and insulin sensitivity.Appl Physiol Nutr Metab. 2009 Jun;34(3):307-14. doi: 10.1139/H09-008. Appl Physiol Nutr Metab. 2009. PMID: 19448691 Review.
-
PGC-1alpha-mediated adaptations in skeletal muscle.Pflugers Arch. 2010 Jun;460(1):153-62. doi: 10.1007/s00424-010-0834-0. Epub 2010 Apr 19. Pflugers Arch. 2010. PMID: 20401754 Review.
Cited by
-
Skeletal Muscle-specific PGC-1α Overexpression Suppresses Atherosclerosis in Apolipoprotein E-Knockout Mice.Sci Rep. 2019 Mar 11;9(1):4077. doi: 10.1038/s41598-019-40643-1. Sci Rep. 2019. PMID: 30858489 Free PMC article.
-
Narciclasine attenuates diet-induced obesity by promoting oxidative metabolism in skeletal muscle.PLoS Biol. 2017 Feb 16;15(2):e1002597. doi: 10.1371/journal.pbio.1002597. eCollection 2017 Feb. PLoS Biol. 2017. PMID: 28207742 Free PMC article.
-
The hitchhiker's guide to PGC-1α isoform structure and biological functions.Diabetologia. 2015 Sep;58(9):1969-77. doi: 10.1007/s00125-015-3671-z. Epub 2015 Jun 25. Diabetologia. 2015. PMID: 26109214 Review.
-
Endothelial fatty acid transport: role of vascular endothelial growth factor B.Physiology (Bethesda). 2013 Mar;28(2):125-34. doi: 10.1152/physiol.00042.2012. Physiology (Bethesda). 2013. PMID: 23455771 Free PMC article. Review.
-
High-Intense Interval Training Prevents Cognitive Impairment and Increases the Expression of Muscle Genes FNDC5 and PPARGC1A in a Rat Model of Alzheimer's Disease.Curr Alzheimer Res. 2022;19(12):830-840. doi: 10.2174/1567205020666221207103109. Curr Alzheimer Res. 2022. PMID: 36503461
References
-
- Lee DC, Sui X, Ortega FB, Kim YS, Church TS, et al. Comparisons of leisure-time physical activity and cardiorespiratory fitness as predictors of all-cause mortality in men and women. Br J Sports Med. 2011;45:504–510. - PubMed
-
- Kodama S, Saito K, Tanaka S, Maki M, Yachi Y, et al. Cardiorespiratory fitness as a quantitative predictor of all-cause mortality and cardiovascular events in healthy men and women: a meta-analysis. JAMA. 2009;301:2024–2035. - PubMed
-
- Bouchard C, Daw EW, Rice T, Perusse L, Gagnon J, et al. Familial resemblance for VO2max in the sedentary state: the HERITAGE family study. Med Sci Sports Exerc. 1998;30:252–258. - PubMed
Publication types
MeSH terms
Substances
LinkOut - more resources
Full Text Sources
Other Literature Sources
Molecular Biology Databases

