Predicting the effects of copy-number variation in double and triple mutant combinations
- PMID: 22174259
- PMCID: PMC3334851
Predicting the effects of copy-number variation in double and triple mutant combinations
Abstract
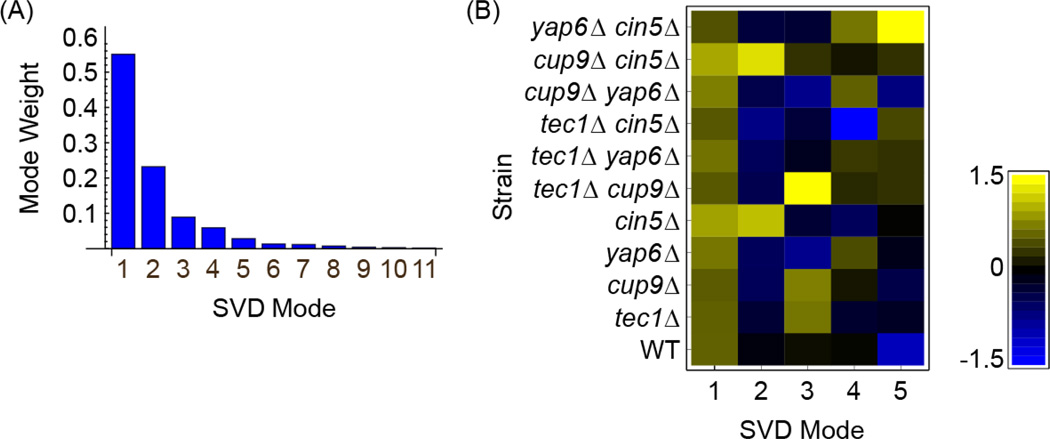
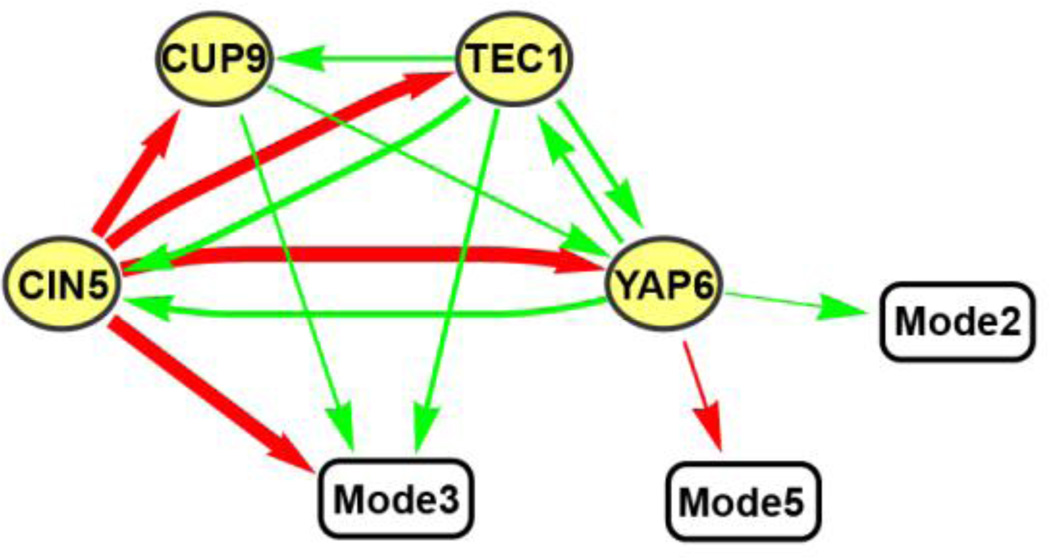
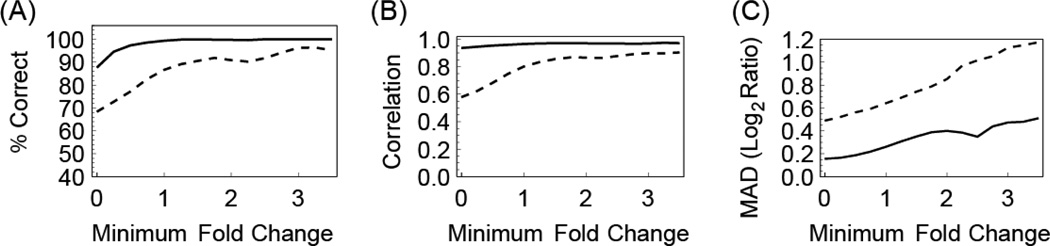
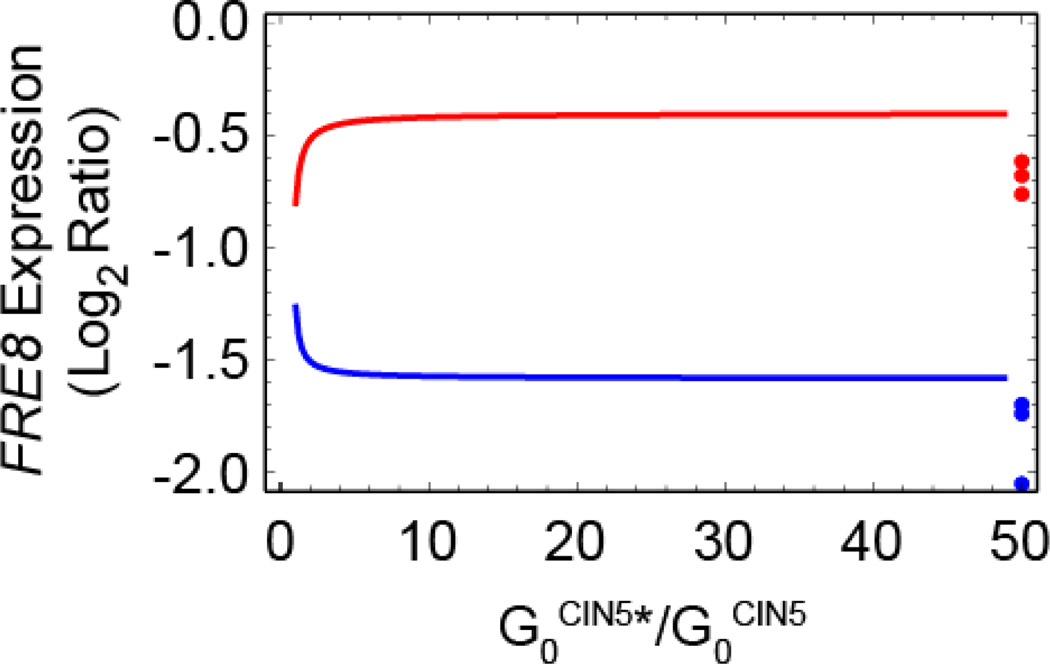
The study of genetic interactions is a powerful tool in inferring structure and function of biological networks. To date, genetic interaction studies have been dominated by pair-wise gene deletion screens. However, classical genetic analysis and natural genetic variation involve diverse gene forms ranging from null alleles to copy number variants. Moreover, genetic variation is typically multifactorial. Addressing multiple combinatorial genetic variations ranging in gene activity is therefore of critical value. We approach this problem using genetic network modeling that quantitatively encodes how genes influence the activity of one another and phenotype outcomes. A network model was initially inferred from linear decomposition of gene expression data. We used this network to predict the effects of combining multi-copy and deletion mutations of specific gene pairs and a gene triplet. Predicted expression patterns across hundreds of genes were experimentally validated. Prediction success was critically dependent on how a multi-copy gene interacted with other genes in the network model. This strategy provides a template for the inference, prediction, and testing of genetically complex hypotheses involving diverse genetic variation.
Figures
Similar articles
-
Prediction of phenotype and gene expression for combinations of mutations.Mol Syst Biol. 2007;3:96. doi: 10.1038/msb4100137. Epub 2007 Mar 27. Mol Syst Biol. 2007. PMID: 17389876 Free PMC article.
-
Transcriptional regulatory networks in Saccharomyces cerevisiae.Science. 2002 Oct 25;298(5594):799-804. doi: 10.1126/science.1075090. Science. 2002. PMID: 12399584
-
Defining transcriptional networks through integrative modeling of mRNA expression and transcription factor binding data.BMC Bioinformatics. 2004 Mar 18;5:31. doi: 10.1186/1471-2105-5-31. BMC Bioinformatics. 2004. PMID: 15113405 Free PMC article.
-
Exploratory and confirmatory gene expression profiling of mac1Delta.J Biol Chem. 2004 Feb 6;279(6):4450-8. doi: 10.1074/jbc.M212308200. Epub 2003 Oct 8. J Biol Chem. 2004. PMID: 14534306
-
Does the study of genetic interactions help predict the function of mitochondrial proteins in Saccharomyces cerevisiae?Biochimie. 2014 May;100:27-37. doi: 10.1016/j.biochi.2013.11.004. Epub 2013 Nov 19. Biochimie. 2014. PMID: 24262604 Review.
Cited by
-
Use of pleiotropy to model genetic interactions in a population.PLoS Genet. 2012;8(10):e1003010. doi: 10.1371/journal.pgen.1003010. Epub 2012 Oct 11. PLoS Genet. 2012. PMID: 23071457 Free PMC article.
-
Past Roadblocks and New Opportunities in Transcription Factor Network Mapping.Trends Genet. 2016 Nov;32(11):736-750. doi: 10.1016/j.tig.2016.08.009. Epub 2016 Oct 6. Trends Genet. 2016. PMID: 27720190 Free PMC article. Review.
References
-
- Visscher PM, Montgomery GW. JAMA. 2009;302:2028. - PubMed
Publication types
MeSH terms
Substances
Grants and funding
LinkOut - more resources
Full Text Sources
Molecular Biology Databases