

Cardiac reactive oxygen species after traumatic brain injury
- PMID: 22172132
- PMCID: PMC3299814
- DOI: 10.1016/j.jss.2011.09.056
Cardiac reactive oxygen species after traumatic brain injury
Abstract
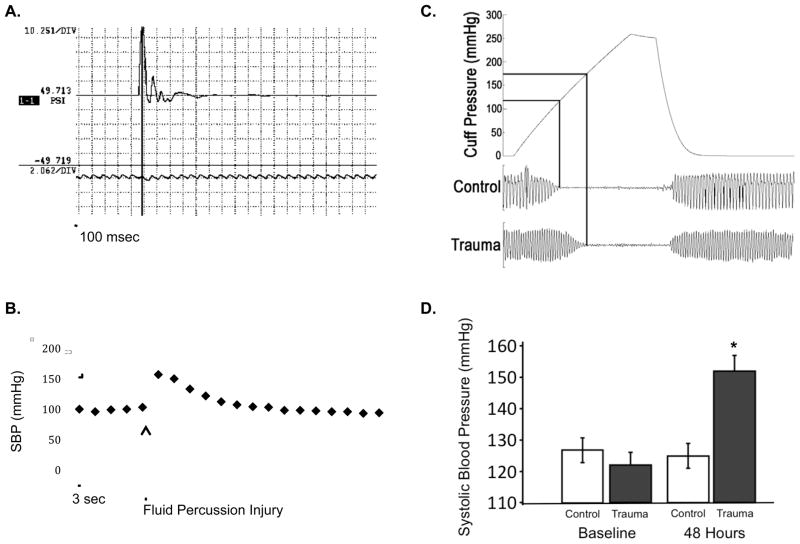
Background: Cardiovascular complications after traumatic brain injury (TBI) contribute to morbidity and mortality and may provide a target for therapy. We examined blood pressure and left ventricle contractility after TBI, and tested the hypothesis that β-adrenergic blockade would decrease oxidative stress after TBI.
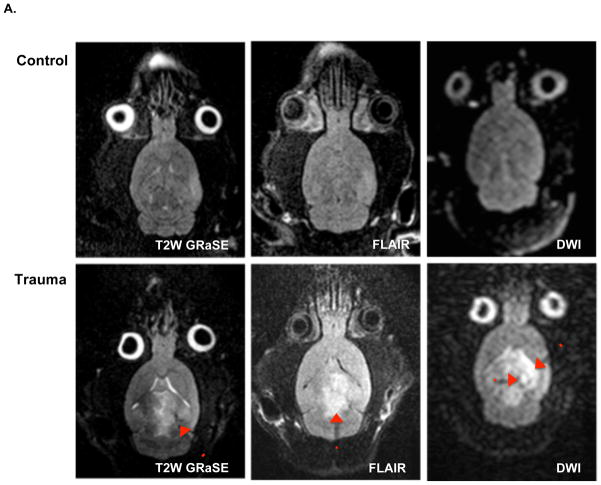
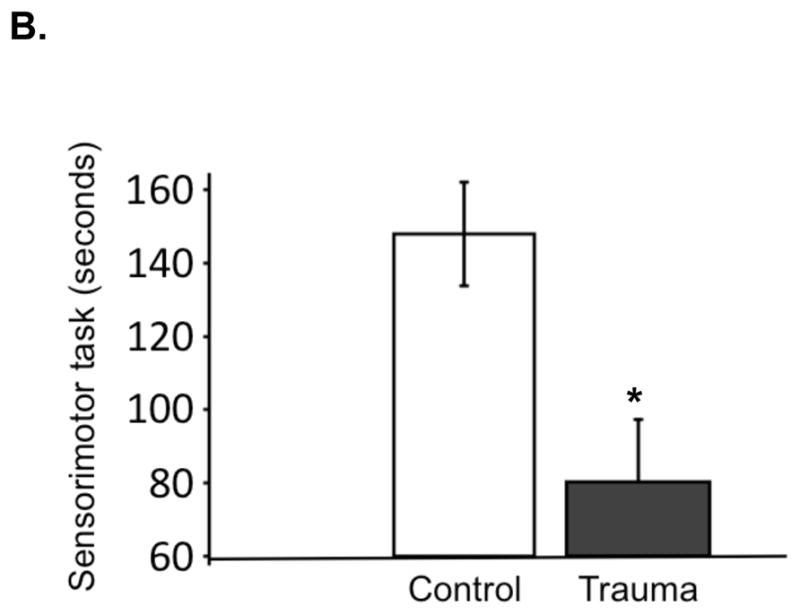
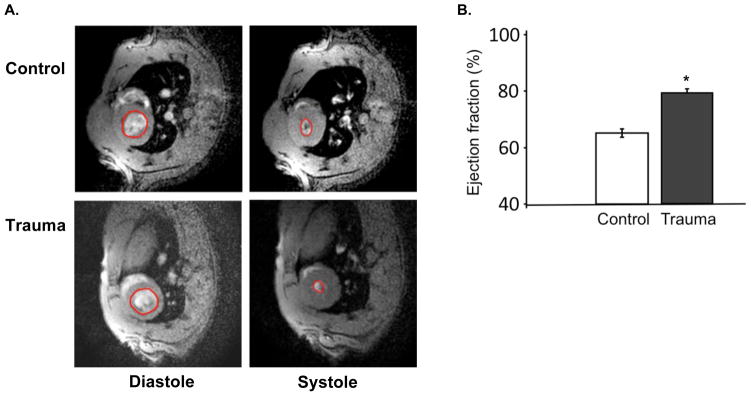
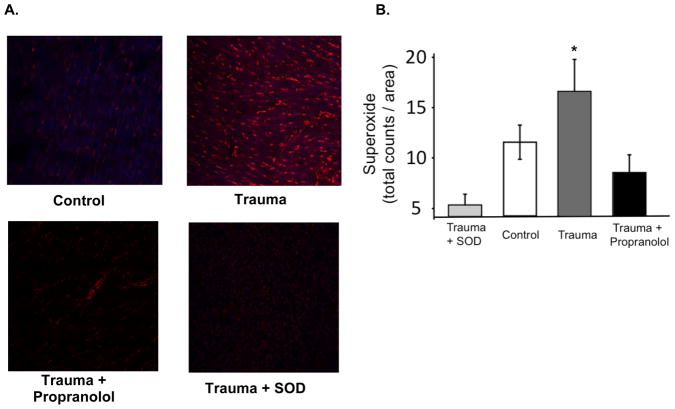
Material and methods: Rodents received fluid-percussion injury or sham surgery, confirmed with magnetic resonance imaging (MRI) and histopathology. We followed recovery with sensorimotor coordination testing and blood pressure measurements. We assessed left ventricular ejection fraction using ECG-gated cardiac MRI and measured myocardial reactive oxygen species (ROS) with dihydroethidium. We randomized additional TBI and sham animals to postoperative treatment with propranolol or control, for measurement of ROS.
Results: Blood pressure and cardiac contractility were elevated 48 h after TBI. Myocardial tissue sections showed increased ROS. Treatment with propranolol diminished ROS levels following TBI.
Conclusions: TBI is associated with increased cardiac contractility and myocardial ROS; decreased myocardial ROS after β-blockade suggests that sympathetic stimulation is a mechanism of oxidative stress.
Copyright © 2012 Elsevier Inc. All rights reserved.
Figures

Comment in
-
Understanding the brain-heart axis in neurological trauma.J Surg Res. 2012 Mar;173(1):e33-5. doi: 10.1016/j.jss.2011.10.040. Epub 2011 Nov 19. J Surg Res. 2012. PMID: 22221598 No abstract available.
Similar articles
-
Protective effects of hydrogen-rich saline in a rat model of traumatic brain injury via reducing oxidative stress.J Surg Res. 2012 Nov;178(1):e9-16. doi: 10.1016/j.jss.2011.12.038. Epub 2012 Mar 22. J Surg Res. 2012. PMID: 22475349
-
Proteomic identification of oxidized mitochondrial proteins following experimental traumatic brain injury.J Neurotrauma. 2007 May;24(5):772-89. doi: 10.1089/neu.2006.0229. J Neurotrauma. 2007. PMID: 17518533
-
Post-Injury Administration of Mitochondrial Uncouplers Increases Tissue Sparing and Improves Behavioral Outcome following Traumatic Brain Injury in Rodents.J Neurotrauma. 2007 May;24(5):798-811. doi: 10.1089/neu.2006.3673. J Neurotrauma. 2007. PMID: 17518535
-
Propranolol protects cerebral autoregulation and reduces hippocampal neuronal cell death through inhibition of interleukin-6 upregulation after traumatic brain injury in pigs.Br J Anaesth. 2019 Nov;123(5):610-617. doi: 10.1016/j.bja.2019.07.017. Epub 2019 Sep 18. Br J Anaesth. 2019. PMID: 31542162 Free PMC article.
-
Decreasing adrenergic or sympathetic hyperactivity after severe traumatic brain injury using propranolol and clonidine (DASH After TBI Study): study protocol for a randomized controlled trial.Trials. 2012 Sep 26;13:177. doi: 10.1186/1745-6215-13-177. Trials. 2012. PMID: 23013802 Free PMC article. Clinical Trial.
Cited by
-
Intramyocardial injection of human adipose-derived stem cells ameliorates cognitive deficit by regulating oxidative stress-mediated hippocampal damage after myocardial infarction.J Mol Med (Berl). 2021 Dec;99(12):1815-1827. doi: 10.1007/s00109-021-02135-6. Epub 2021 Oct 11. J Mol Med (Berl). 2021. PMID: 34633469 Free PMC article.
-
Targeting hydrogen sulfide and nitric oxide to repair cardiovascular injury after trauma.Nitric Oxide. 2022 Dec 1;129:82-101. doi: 10.1016/j.niox.2022.10.003. Epub 2022 Oct 22. Nitric Oxide. 2022. PMID: 36280191 Free PMC article. Review.
-
Inflammatory responses mediate brain-heart interaction after ischemic stroke in adult mice.J Cereb Blood Flow Metab. 2020 Jun;40(6):1213-1229. doi: 10.1177/0271678X18813317. Epub 2018 Nov 22. J Cereb Blood Flow Metab. 2020. PMID: 30465612 Free PMC article.
-
Traumatic brain injury impairs sensorimotor function in mice.J Surg Res. 2017 Jun 1;213:100-109. doi: 10.1016/j.jss.2017.02.016. Epub 2017 Feb 23. J Surg Res. 2017. PMID: 28601302 Free PMC article.
-
Beta1-receptor blockade attenuates atherosclerosis progression following traumatic brain injury in apolipoprotein E deficient mice.PLoS One. 2023 May 26;18(5):e0285499. doi: 10.1371/journal.pone.0285499. eCollection 2023. PLoS One. 2023. PMID: 37235594 Free PMC article.
References
-
- Faul MXL, Wald MM, Coronado VG. Traumatic Brain Injury in the United States: Emergency Department Visits, Hospitalizations and Deaths 2002–2006. Centers for Disease Control and Prevention, National Center for Injury Prevention and Control; Atlanta (GA): 2010.
-
- Bybee KA, Prasad A. Stress-related cardiomyopathy syndromes. Circulation. 2008 Jul 22;118(4):397–409. - PubMed
-
- Clifton GL, Robertson CS, Kyper K, Taylor AA, Dhekne RD, Grossman RG. Cardiovascular response to severe head injury. Journal of neurosurgery. 1983 Sep;59(3):447–454. - PubMed
-
- Clifton GL, Ziegler MG, Grossman RG. Circulating catecholamines and sympathetic activity after head injury. Neurosurgery. 1981 Jan;8(1):10–14. - PubMed
-
- Robertson CS, Clifton GL, Grossman RG. Oxygen utilization and cardiovascular function in head-injured patients. Neurosurgery. 1984 Sep;15(3):307–314. - PubMed
Publication types
MeSH terms
Substances
Grants and funding
LinkOut - more resources
Full Text Sources
