. 2012 Aug 30;31(35):3973-88.
doi: 10.1038/onc.2011.568. Epub 2011 Dec 12.

Sp1 expression regulates lung tumor progression

Affiliations
Free PMC article

Sp1 expression regulates lung tumor progression

T-I Hsu et al. Oncogene. .
Free PMC article

Abstract

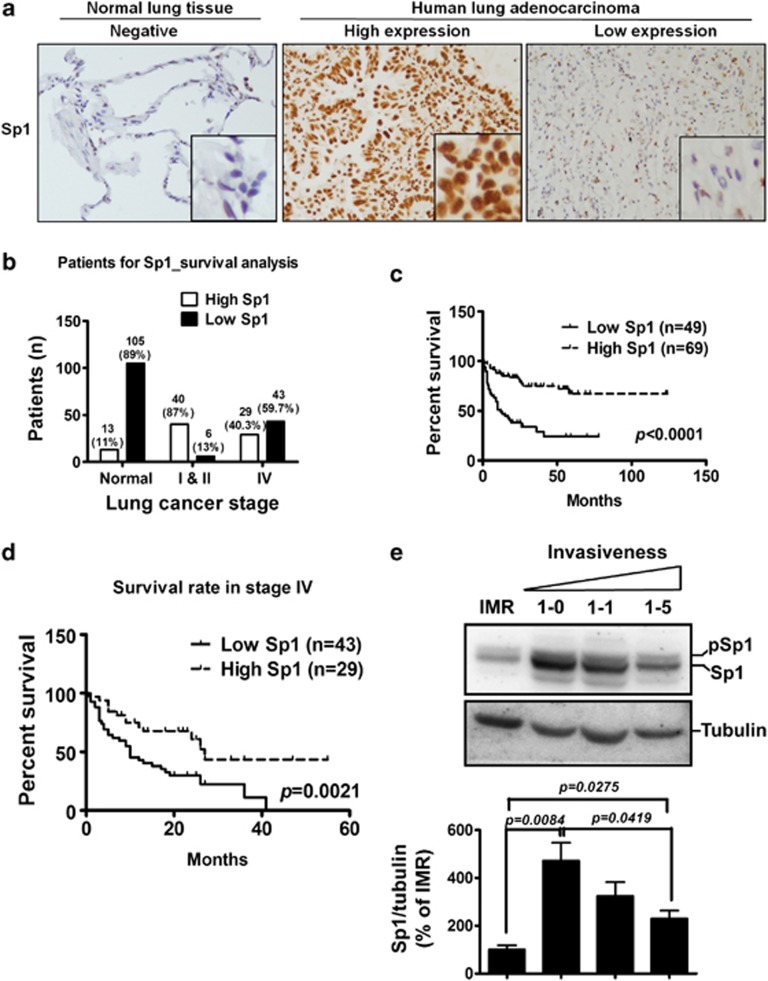
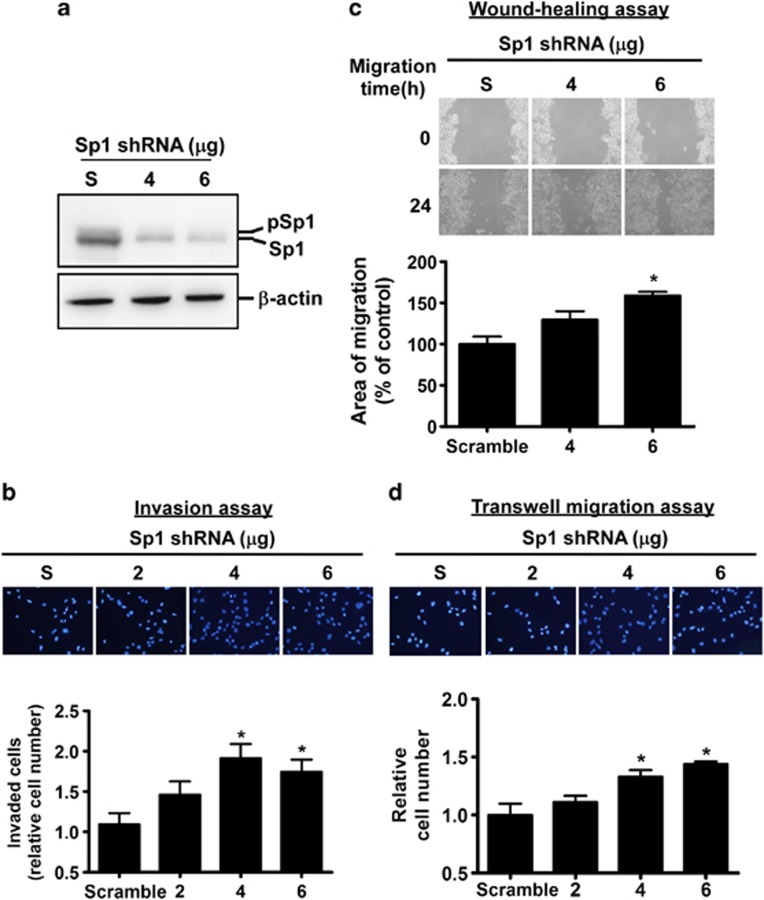
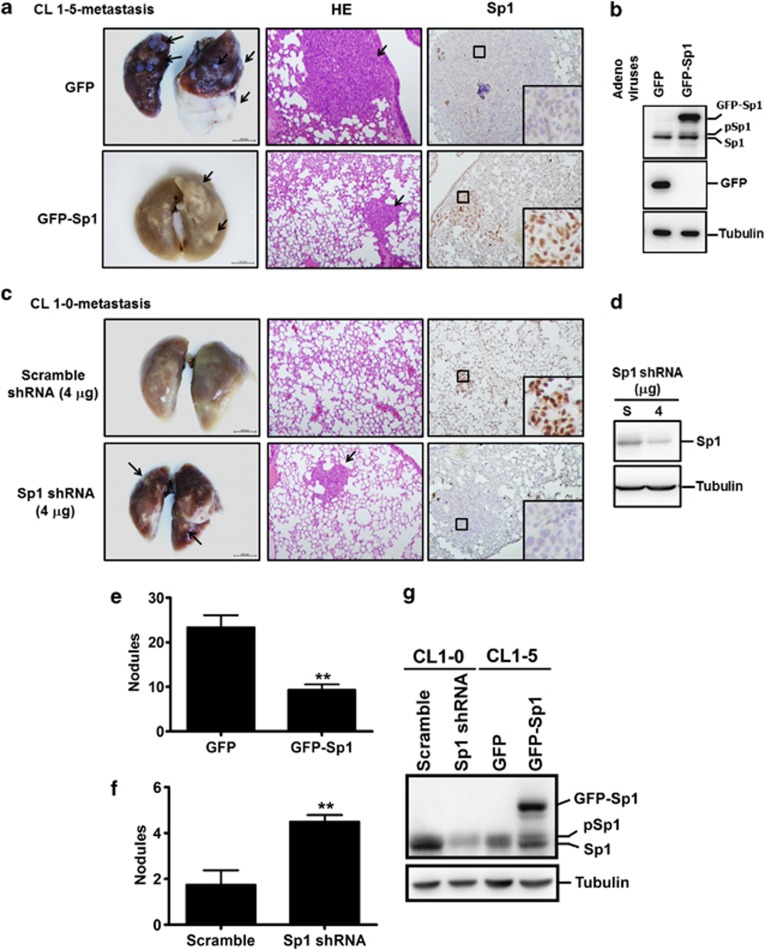
The role of specificity protein 1 (Sp1) in controlling gene expression in lung tumor development and metastasis is not well understood. In this study, we showed that the Sp1 level was highly increased and required for lung tumor growth in transgenic mice bearing Kras-induced lung tumors under the control of doxycycline. Furthermore, the Sp1 level was highly upregulated in lung adenocarcinoma cells with low invasiveness and in patients with stage I lung cancer. We also demonstrated that Sp1 was downregulated in lung adenocarcinoma cells with high invasiveness and in patients with stage IV lung adenocarcinoma. Moreover, Sp1 inversely regulated migration, invasion and metastasis of lung adenocarcinoma cells in vivo. In addition, a decrease in the Sp1 level in highly invasive lung adenocarcinoma cells resulted from instability of the Sp1 protein. Furthermore, overexpression of Sp1 in highly invasive lung adenocarcinoma cells increased expression of E-cadherin, a suppressor of metastasis, and attenuated the translocation of β-catenin into the cellular nucleus that leads to tumor malignancy. Taken together, Sp1 level accumulated strongly in early stage and then declined in late stage, which is important for lung cancer cell proliferation and metastasis during tumorigenesis.


Figures

Figure 1
Figure 1
MMA prevents doxycycline-induced pathological changes in the lungs of bitransgenic mice. (a) Doxycycline-induced lung tumor formation accompanied by increases in Sp1 and Kras in bitransgenic mice. After treatment for 1–5 months, lungs were excised for paraffin sections. Sections were prepared for hematoxylin and eosin (HE) staining and Sp1, Kras, pErk, proliferating cellular nuclear antigen (PCNA) and CCSP immunohistochemical staining. Stained sections were visualized using light microscopy ( × 200). (b) On each excised lung, surface pulmonary tumor nodules were counted. One spot represents one mouse. (c) After IHC staining, the Sp1 signal on each slide was semiquantitated by H-score. (d) After doxycycline treatment, lungs were collected for protein extraction, and analyzed by western blotting with anti-Kras and Sp1 antibodies. Data of eight independent experiments are represented as mean±s.e.m. (*P<0.05). (e) Prevention of Kras-induced lung tumorigenesis under the control of doxycycline by MMA. (Upper panel) Time course of doxycycline and MMA treatment. (Lower panel) HE and IHC staining using anti-Sp1 and Kras antibodies of lungs from treated bitransgenic mice. (f) After doxycycline administration for 5 months with MMA treatment in the last 2 months, lungs were excised from mice and pulmonary tumor nodules were counted. (g) H-score for the Sp1 signal on each slide. (h) MMA treatment attenuated Sp1 upregulation in Kras-induced lung tumorigenesis. pSp1 represents phosphorylated Sp1 and data of eight independent experiments are represented as mean±s.e.m. (*P<0.05).
Figure 2
Figure 2
Sp1 expression is negatively correlated with survival of lung adenocarcinoma patients. (a) IHC staining of Sp1 in clinically resected normal lung tissue and lung adenocarcinoma. (b) Sp1 expression in different stages of lung adenocarcinoma patients and the corresponding normal lung tissue. (c, d) Kaplan–Meier analysis of overall survival in 118 patients with lung adenocarcinoma ranging from stages I to IV including 72 patients with stage IV. The Sp1 level was detected by IHC staining in resected lung adenocarcinoma. The P-value was determined by a two-sided log-rank test. (e) Sp1 expression in normal lung fibroblast (IMR) and CL-series cell lines with increasing invasiveness. Cells were harvested for whole-cell lysates and cellular proteins were immunoblotted with anti-Sp1 and tubulin antibodies. pSp1 represents phosphorylated Sp1 and data are representative of three independent experiments and are presented as mean±s.e.m. The P-value is indicated.
Figure 3
Figure 3
Sp1 negatively regulates invasive and migratory abilities of lung cancer cells. (a) CL1-5 cells were infected with adenovirus-GFP and increasing doses (1–20 m.o.i.) of adenovirus-GFP-Sp1. After incubation for 48 h, cells were harvested for whole-cell lysates and cellular proteins were immunoblotted with anti-Sp1, CCSP and actin antibodies. pSp1 represents phosphorylated Sp1. (Lower panel) The quantitated result for the ratio of exogenous GFP-Sp1 with endogenous Sp1, both of which were normalized by β-actin. (b) The morphologies of adenovirus-GFP- and GFP-Sp1-infected CL1-5 cells were observed using light microscope with × 100 magnification. (c) Effect of Sp1 on invasive ability. The in vitro invasive ability of CL1-5 cells infected with adenovirus-GFP or GFP-Sp1 was determined using Matrigel-combined Transwell chambers as described in Materials and methods. Data are representative of three independent experiments and are presented as mean±s.e.m. (*P<0.05). (d) Effect of Sp1 on the migratory ability of cells measured with a wound-healing assay. After infection with adenovirus-GFP or GFP-Sp1 for 48 h, confluent monolayers of CL1-5 were wounded with a pipette tip and incubated for an additional 24 h. The migratory area of cells was calculated for quantification. Data are representative of three independent experiments and are presented as mean±s.e.m. (*P<0.05). (e) Effect of Sp1 on migratory ability examined by a Transwell migration assay. After infection for 48 h, the migratory ability of adenovirus-GFP or GFP-Sp1-infected cells was determined using Transwell chambers as described in Materials and methods. Data are representative of three independent experiments and are presented as mean±s.e.m. (*P<0.05). (f) Effect of Sp1 on migratory ability monitored by video time-lapse microscopy. After infection with adenovirus-GFP or GFP-Sp1 for 48 h, the migratory area of CL1-5 cells was continually monitored for 24 h under a time-lapse microscopy at × 100 magnification.
Figure 4
Figure 4
Sp1 knockdown enhances invasive and migratory abilities of CL1-0 cells. (a) CL1-0 cells were transfected with scrambled or Sp1 small hairpin RNA (shRNA). After incubation for 48 h, cells were harvested for whole-cell lysates and cellular proteins were immunoblotted with anti-Sp1 and actin antibodies. (b) Effect of Sp1 knockdown on invasive ability. The in vitro invasive ability of CL1-0 cells transfected with scrambled or Sp1 shRNA was determined using Matrigel-combined Transwell chambers as described in Materials and methods. Data are representative of three independent experiments and are presented as mean±s.e.m. (*P<0.05). (c) Effect of Sp1 knockdown on the migratory ability measured by wound-healing assay. After transfection with scrambled or Sp1 shRNA for 48 h, confluent monolayers of CL1-0 were wounded and incubated for an additional 24 h. Migratory area was calculated for quantification. Data are representative of three independent experiments and are presented as mean±s.e.m. (*P<0.05). (d) Effect of Sp1 knockdown on the migratory ability examined by Transwell migration assay. The migratory ability of scrambled or Sp1 shRNA-transfected cells was determined by Transwell chambers. Data are representative of three independent experiments and are presented as mean±s.e.m. (*P<0.05).
Figure 5
Figure 5
Sp1 suppresses lung adenocarcinoma cell metastasis in vivo. (a) After infection of GFP or GFP-Sp1 adenovirus for 48 h, CL1-5 cells ( × 106) were suspended in 100 μl of PBS and injected into the lateral tail vein of severe combined immunodeficient (SCID) mice. After 4 weeks, all mice were killed and the number of pulmonary tumor nodules was calculated 48 h after fixation of lungs with 10% formaldehyde. (Left panel) Representative images of lungs. Arrows indicate pulmonary metastatic tumor nodules. (Central panel) Hematoxylin and eosin (HE) staining of lungs. Arrows indicate pulmonary metastatic tumor. (Right panel) IHC staining using the anti-Sp1 antibody. (b) Confirmation of GFP and GFP-Sp1 expression of CL1-5 cells injected into mice by western blotting. (c) Effects of Sp1 knockdown on in vivo metastasis of CL1-0 cells. (Left panel) Representative images of lungs. (Central panel) HE staining of lungs. (Right panel) Sp1 IHC staining. (d) Confirmation of Sp1 knockdown in CL1-0 cells injected into mice by western blotting. (e, f) Quantitative result (five mice per group) of pulmonary metastatic tumor nodules 4 weeks after injection. Data are expressed as mean±s.e.m. (**P<0.01). (g) Sp1 expression in both CL1-0 and CL1-5 cells that were injected into the tail vein was compared. pSp1 represents phosphorylated Sp1.
Figure 6
Figure 6
Downregulation of Sp1 expression in highly invasive lung adenocarcinoma cells is caused by instability of Sp1 protein. (Aa) Whole-cell extracts of cells were collected for western blotting with antibodies against Sp1, pSp1 (T739) and tubulin. Reverse transcriptase–PCR (RT–PCR) was used to determine the mRNA level of Sp1. (Ab) Sumoylation and ubiquitination in an equal Sp1 expression level of CL1-0 and CL1-5 cells. (Ac) The quantitated result for the ratio of pSp1 (T739) with Sp1 in CL1-0 and 1-5 cells. Data are representative of three independent experiments and are presented as mean±s.e.m. (**P<0.01). (B) After MG132 treatment (50 μM) for 6 and 12 h, cells were harvested as whole-cell extracts for western blotting. (C) The association of Sp1 with RNF4. The whole-cell extracts of cells were immunoprecipitated with an anti-RNF4 antibody or IgG, and immunoblotted with an anti-Sp1 antibody. (D) Sp1 sumoylation in CL1-5 cells. Whole-cell extracts of cells were immunoprecipitated with an anti-Sp1 antibody or IgG, and immunoblotted with the antibody against SUMO-1 or Sp1. SUMO-Sp1 is indicated. (E) Sp1 ubiquitination in CL1-5 cells. After overexpression of myc-ubiquitin in the presence of MG132 for 12 h, whole-cell extracts were immunoprecipitated with an anti-Sp1 antibody, and immunoblotted with the antibody against myc or Sp1. Ubi-Sp1 is indicated. pSp1 represents phosphorylated Sp1. (F) Proposed model of Sp1 downregulation caused by Sp1 protein instability in highly invasive lung adenocarcinoma cells.
Figure 7
Figure 7
Sp1 positively regulates E-cadherin expression and attenuates the translocation of β-catenin into the cell nucleus. (a) Whole-cell extracts of CL1-0 and CL1-5 cells were collected for western blotting with antibodies against E-cadherin, β-catenin and β-actin. (b) Binding of Sp1 to the promoter of E-cadherin was determined by chromatin immunoprecipitation (CHIP) assay. (c) Effect of Sp1 knockdown on the protein level of E-cadherin in lung adenocarcinoma cells with low invasiveness. After transfection of scrambled or Sp1 small hairpin RNA (shRNA) for 48 h, whole-cell extracts of CL1-0 and A549 cells were collected for western blotting with antibodies against E-cadherin and β-actin. Quantitated results are shown in the lower panel. Data are representative of three independent experiments and are presented as mean±s.e.m. (*P<0.05, **P<0.01). (d) Effect of Sp1 on the protein levels of E-cadherin and β-catenin in lung adenocarcinoma cells with high invasiveness. After infection with GFP or increasing dosage (1–20 m.o.i.) of GFP-Sp1 adenovirus for 48 h, whole-cell extracts of CL1-5 cells were collected for western blotting using antibodies against E-cadherin, β-catenin and β-actin. pSp1 represents phosphorylated Sp1. Quantitated results are shown in the lower panel. Data are representative of three independent experiments and are presented as mean±s.e.m. (*P<0.05, **P<0.01). (e) Effect of Sp1 on the translocation of β-catenin into nucleus. (Left panel) After infection with GFP or increasing doses of GFP-Sp1 adenovirus for 48 h, cytosolic and nuclear fractions were isolated for western blotting with antibodies against β-catenin, tubulin and histone H3. (Right panel) Data are representative of three independent experiments and are presented as mean±s.e.m. (*P<0.05, **P<0.01). (f) Immunofluorescent staining of nuclear GFP-Sp1 and β-catenin in CL1-5 cells. After infection of cells with adenovirus-expressing GFP-Sp1 for 48 h, cells on a coverslip were stained with an anti-β-catenin antibody and DAPI. Stained cells were photographed under a fluorescence microscope at × 1000 magnification. (g) Effect of Sp1 on the expression of T-cell factor-4 (Tcf4), a target gene of β-catenin. After infection of cells with adenovirus expressing GFP-Sp1 for 48 h, RNA was prepared for reverse transcriptase–PCR (RT–PCR). (h) The proposed model showing that Sp1 blocked β-catenin translocation into the cell nucleus through inducing E-cadherin, which was shown to anchor β-catenin near plasma membrane.
Figure 8
Figure 8
Sp1 expression regulates lung tumor progression. (a) Sp1 expression is maintained at the lowest level in normal cells. Until cell transformation or tumor formation, Sp1 expression is highly upregulated. When tumor cells became more invasive or malignant, Sp1 expression is obviously decreased. (b) The lowest Sp1 level for basal gene transcription is maintained by protein instability triggered by sumoylation and ubiquitination. In lung tumor cells, the Sp1 level is upregulated for proliferation accompanied by the increased level of E-cadherin for adhesion. In highly invasive lung tumor cells, E-cadherin, which anchors β-catenin near the plasma membrane, is lost because of the downregulation of Sp1 level triggered by protein instability. Consequently, downregulation of Sp1 level increases the amount of nuclear β-catenin for gene transcription related to metastasis.

Similar articles

Cited by

References

    1. Black AR, Black JD, Azizkhan-Clifford J. Sp1 and kruppel-like factor family of transcription factors in cell growth regulation and cancer. J Cell Physiol. 2001;188:143–160. - PubMed
    1. Bremnes RM, Veve R, Hirsch FR, Franklin WA. The E-cadherin cell-cell adhesion complex and lung cancer invasion, metastasis, and prognosis. Lung Cancer. 2002;36:115–124. - PubMed
    1. Bu Y, Gao L, Gelman IH. Role for transcription factor TFII-I in the suppression of SSeCKS/Gravin/Akap12 transcription by Src. Int J Cancer. 2010;128:1836–42. - PMC - PubMed
    1. Chang HC, Liu LT, Hung WC. Involvement of histone deacetylation in ras-induced down-regulation of the metastasis suppressor RECK. Cell Signal. 2004;16:675–679. - PubMed
    1. Chao YC, Pan SH, Yang SC, Yu SL, Che TF, Lin CW, et al. Claudin-1 is a metastasis suppressor and correlates with clinical outcome in lung adenocarcinoma. Am J Respir Crit Care Med. 2009;179:123–133. - PubMed

Publication types

MeSH terms