. 2012 Jan 27;287(5):3197-206.
doi: 10.1074/jbc.M111.280271. Epub 2011 Dec 5.

Acyl chain specificity of ceramide synthases is determined within a region of 150 residues in the Tram-Lag-CLN8 (TLC) domain

Affiliations

Acyl chain specificity of ceramide synthases is determined within a region of 150 residues in the Tram-Lag-CLN8 (TLC) domain

Rotem Tidhar et al. J Biol Chem. .

Abstract

In mammals, ceramides are synthesized by a family of six ceramide synthases (CerS), transmembrane proteins located in the endoplasmic reticulum, where each use fatty acyl-CoAs of defined chain length for ceramide synthesis. Little is known about the molecular features of the CerS that determine acyl-CoA selectivity. We now explore CerS structure-function relationships by constructing chimeric proteins combining sequences from CerS2, which uses C22-CoA for ceramide synthesis, and CerS5, which uses C16-CoA. CerS2 and -5 are 41% identical and 63% similar. Chimeras containing approximately half of CerS5 (from the N terminus) and half of CerS2 (from the C terminus) were catalytically inactive. However, the first 158 residues of CerS5 could be replaced with the equivalent region of CerS2 without affecting specificity of CerS5 toward C16-CoA; likewise, the putative sixth transmembrane domain (at the C terminus) of CerS5 could be replaced with the corresponding sequence of CerS2 without affecting CerS5 specificity. Remarkably, a chimeric CerS5/2 protein containing the first 158 residues and the last 83 residues of CerS2 displayed specificity toward C16-CoA, and a chimeric CerS2/5 protein containing the first 150 residues and the last 79 residues of CerS5 displayed specificity toward C22-CoA, demonstrating that a minimal region of 150 residues is sufficient for retaining CerS specificity.


Figures

FIGURE 1.
FIGURE 1.
CerS phylogeny, sequence comparison, and topology. A, shown is a phylogenetic tree of the six human CerS. Bootstrap values (of 100) are indicated. Acyl CoA specificity is shown in parenthesis. Sequences were aligned with ClustalW, and phylogenetic analysis was performed with Maximum likelihood (proml, from the phylip package); similar results were obtained with Neighbor Joining and both phylogenetic algorithms on a Muscle alignment. B, shown is a comparison of hCerS2 and hCerS5 sequences by ClustalW multiple alignments. The asterisks (*) indicate identical residues (in blue), colons (:), and periods (.) indicate similar residues, with colons indicating more similarity than periods. The two conserved histidine residues are in red, and predicted transmembrane domains are in boxes. The lines above the sequences indicate the three major domains: Hox-like domain (green), TLC domain (purple), and Lag1p-motif (blue). Residues highlighted in yellow at the border of the TLC domain indicate 12 residues shown to be important for activity (18); residues highlighted in yellow in the Lag1p motif indicate equivalent residues to those previously mutated in either CerS1 or CerS5 or in yeast Lag1p: a, mutated in mouse CerS resulting in loss of activity; b, mutated in mouse CerS without affecting activity (16); c, mutated in yeast Lag1 resulting in loss of activity; d, mutated in yeast Lag1 without affecting activity (17). C, shown are transmembrane predictions of hCerS5 performed with DAS TMfilter, HMMTOP, MemBrain, MEMSAT, oreinTM, PHD, Philius, Phobius, SOSUI, Split 4.0, SVMTM, TMHMM, Tmpred, TOPCONS, and Toppred. The red lines indicate a putative transmembrane domain suggested by each of the prediction programs. The numbered black lines indicating membrane-spanning domains are taken from the PHD prediction, which is used throughout the study. TMD, transmembrane domain.
FIGURE 2.
FIGURE 2.
Chimeras of CerS2 and CerS5. A, shown is a schematic representation of the three distinguishing domains of mammalian CerS5 and CerS2: Hox-like domain (stripes), TLC domain (gray), Lag1p motif (black). B, shown is a schematic representation of the 17 chimeras used in this study. The left column gives the name of the protein and the amino acid residues used; for instance, CerS2(1–143):CerS5(152–392) consists of the first 143 residues of CerS2 (in blue) and residues 152–392 of CerS5 (in pink); note the discrepancy in the numbering of CerS5 and CerS2, as CerS2 contains 12 residues less than CerS5. The abbreviated names used throughout the text are shown in the middle column. The right column shows a schematic representation of the chimeric proteins with CerS5 in pink and CerS2 in blue. The black vertical dotted lines indicate the beginning and end of the TLC domain, and the gray dotted vertical lines indicate the boundaries of the Lag1p motif.
FIGURE 3.
FIGURE 3.
Expression levels of chimeric proteins. Levels of expression of the FLAG-tagged constructs ascertained by Western blotting using an anti-FLAG antibody. An anti-GAPDH antibody was used as loading control. Molecular weight markers are shown. The Western blot is a typical experiment repeated between two-four times.
FIGURE 4.
FIGURE 4.
CerS5 and CerS 2 activity in chimeras containing the N terminus of CerS5 and the C terminus of CerS2. A, homogenates (100 μg of protein) were prepared from cells overexpressing the indicated constructs (for terminology, see Fig. 2). CerS5 activity was assayed using C16-CoA (upper panel) and CerS2 using C22-CoA (lower panel). Results are the means ± S.D. of a typical experiment repeated three times with similar results. *, p < 0.05. B, putative membrane topology of each construct is shown. The topology is based on six predicted transmembrane domains (Fig. 1); regions provided by CerS5 are shown in dark gray and CerS2 are in light gray.
FIGURE 5.
FIGURE 5.
CerS5 and 2 activity in chimeras containing the N terminus of CerS2 and the C terminus of CerS5. A, putative membrane topology of construct C2:C5159–392 with the CerS2 sequence is in light gray, and CerS5 is in dark gray; arrowheads mark the positions of the other chimeras presented in this figure. B, homogenates (100 μg of protein) were prepared from cells overexpressing the indicated constructs and activity assayed using C16-CoA. Results are the means ± S.E. for 3–8 individual experiments performed in duplicate and are expressed as percent of the activity of native CerS5. *, p < 0.05. The upper panel shows part of a thin layer chromatography plate illustrating levels of C16-[3H]dihydroceramide synthesis for each construct in a typical experiment. C, shown is activity of C2:C5166–392 using C22-CoA compared with native CerS2. Results are the means ± S.D. of a typical experiment repeated 3 times with similar results. *, p < 0.05.
FIGURE 6.
FIGURE 6.
CerS activity in chimeras containing the C terminus of CerS2. A, shown is the putative membrane topology of construct C51–309:C2, with the CerS2 sequence in light gray and CerS5 in dark gray; arrowheads mark the positions of the other chimeras presented in this figure. B, homogenates (100 μg of protein) were prepared from cells overexpressing the indicated constructs and CerS5 activity assayed using C16-CoA. Results are the means ± S.D. for two individual experiments performed in duplicate and are expressed as percent of the activity of native CerS5. *, p < 0.05. C, shown is activity of C51–296:C2 using C22-CoA compared with native CerS2. Results are the means ± S.D. *, p < 0.05.
FIGURE 7.
FIGURE 7.
Protein stability after cycloheximide treatment. Western blotting of chimeric proteins was performed at various times after addition of cycloheximide. GAPDH was used as a loading control. The Western blot is a typical experiment repeated up to three times.
FIGURE 8.
FIGURE 8.
CerS activity in chimera C2:C5152–340:C2. A, homogenates (100 μg of protein) were prepared from cells overexpressing C2:C5152–340:C2, and activity was assayed using C16-CoA. Results are the means ± S.D. for two individual experiments performed in duplicate and are expressed as percent of CerS5 activity. B, putative membrane topology of the constructs with the CerS2 sequence in light gray and CerS5 in dark gray.
FIGURE 9.
FIGURE 9.
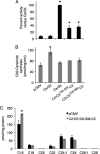
CerS5 specificity of constructs containing the N and C termini of CerS2. A, homogenates (100 μg of protein) were prepared from cells overexpressing the indicated constructs and CerS5 activity assayed using C16-CoA. Results are the means ± S.E. for seven-eight individual experiments performed in duplicate and are expressed as percent of CerS5 activity. *, p < 0.01. B, homogenates (100 μg of protein) were prepared from cells overexpressing the indicated constructs, and CerS2 activity was assayed using C22-CoA. Results are the means ± S.D., n = 2. *, p < 0.05. C, the fatty acid composition of ceramide was determined by electrospray ionization-MS/MS in pCMV- and C2:C5159–309:C2-overexpressing cells. *, p < 0.05.
FIGURE 10.
FIGURE 10.
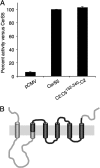
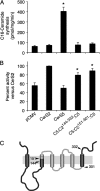
CerS2 specificity of constructs containing the N and C termini of CerS5. A, homogenates (100 μg of protein) were prepared from cells overexpressing the indicated constructs, and CerS5 activity was assayed using C16-CoA. Results are the means ± S.D. *, p < 0.05. B, homogenates (100 μg of protein) were prepared from cells overexpressing the indicated constructs, and CerS2 activity was assayed using C22-CoA. Results are the means ± S.E. for three individual experiments performed in duplicate and are expressed as percent of CerS2 activity. *, p < 0.05. C, shown is putative membrane topology of construct C5:C2151–301:C5 with the CerS2 sequence in light gray and CerS5 in dark gray.
FIGURE 11.
FIGURE 11.
CerS specificity resides within 150 residues in the TLC domain. A, shown is putative membrane topology of CerS. Regions in blue are not involved in specificity, whereas the regions in pink are involved in specificity. The dotted line indicates the Hox-like domain; diagonal lines indicate the beginning and end of the TLC domain and the Lag1p motif. The area in the box indicates the location of the conserved histidine residues. B, human CerS5 and CerS2 homology patterns are presented as a sliding window identity alignment, indicating areas of <30% identity (dark gray) and >30% identity (light gray). A linear diagram of CerS is shown below, indicating areas involved in specificity (pink) and areas not required for specificity (blue).

Similar articles

Cited by

References

    1. Kolesnick R. (2002) The therapeutic potential of modulating the ceramide/sphingomyelin pathway. J. Clin. Invest. 110, 3–8 - PMC - PubMed
    1. Hannun Y. A., Obeid L. M. (2002) The ceramide-centric universe of lipid-mediated cell regulation. Stress encounters of the lipid kind. J. Biol. Chem. 277, 25847–25850 - PubMed
    1. Futerman A. H., Riezman H. (2005) The ins and outs of sphingolipid synthesis. Trends Cell Biol. 15, 312–318 - PubMed
    1. Hannun Y. A., Obeid L. M. (2011) Many ceramides. J. Biol. Chem. 286, 27855–27862 - PMC - PubMed
    1. Pewzner-Jung Y., Ben-Dor S., Futerman A. H. (2006) When do Lasses (longevity assurance genes) become CerS (ceramide synthases)? Insights into the regulation of ceramide synthesis. J. Biol. Chem. 281, 25001–25005 - PubMed

Publication types

MeSH terms

Substances

LinkOut - more resources