. 2011 Dec 20;124(25):2920-32.
doi: 10.1161/CIRCULATIONAHA.110.009910. Epub 2011 Dec 5.

Loss of myeloid related protein-8/14 exacerbates cardiac allograft rejection

Affiliations

Loss of myeloid related protein-8/14 exacerbates cardiac allograft rejection

Koichi Shimizu et al. Circulation. .

Abstract

Background: The calcium-binding proteins myeloid-related protein (MRP)-8 (S100A8) and MRP-14 (S100A9) form MRP-8/14 heterodimers (S100A8/A9, calprotectin) that regulate myeloid cell function and inflammatory responses and serve as early serum markers for monitoring acute allograft rejection. Despite functioning as a proinflammatory mediator, the pathophysiological role of MRP-8/14 complexes in cardiovascular disease is incompletely defined. This study investigated the role of MRP-8/14 in cardiac allograft rejection using MRP-14(-/-) mice that lack MRP-8/14 complexes.

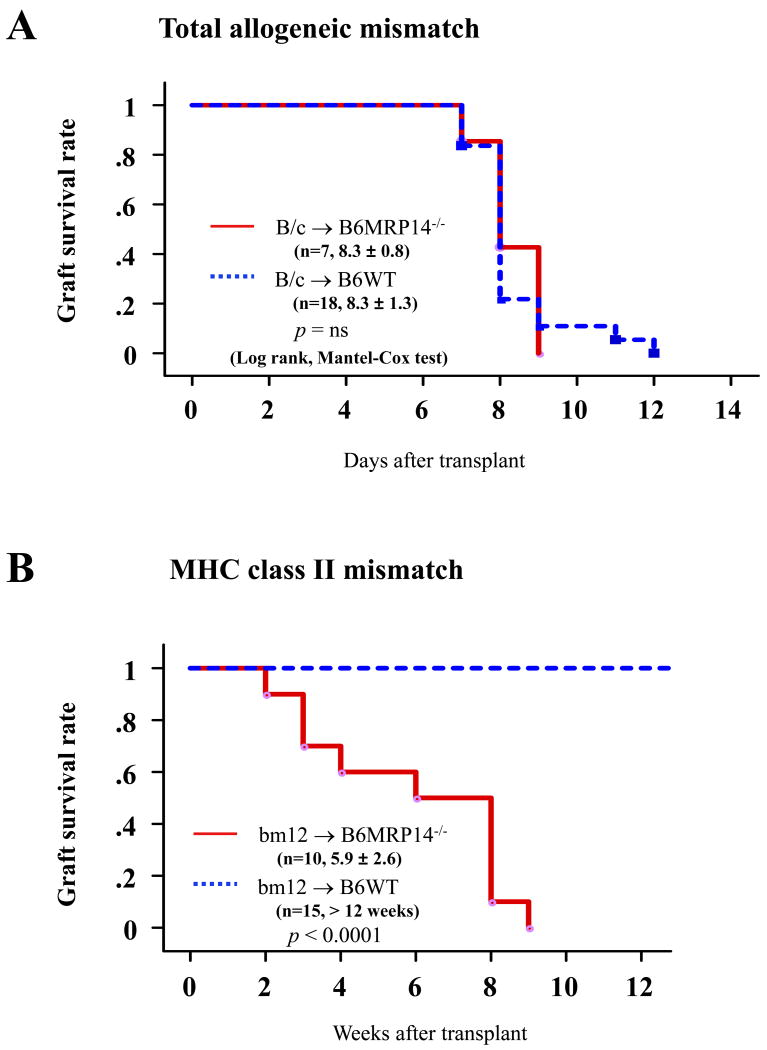
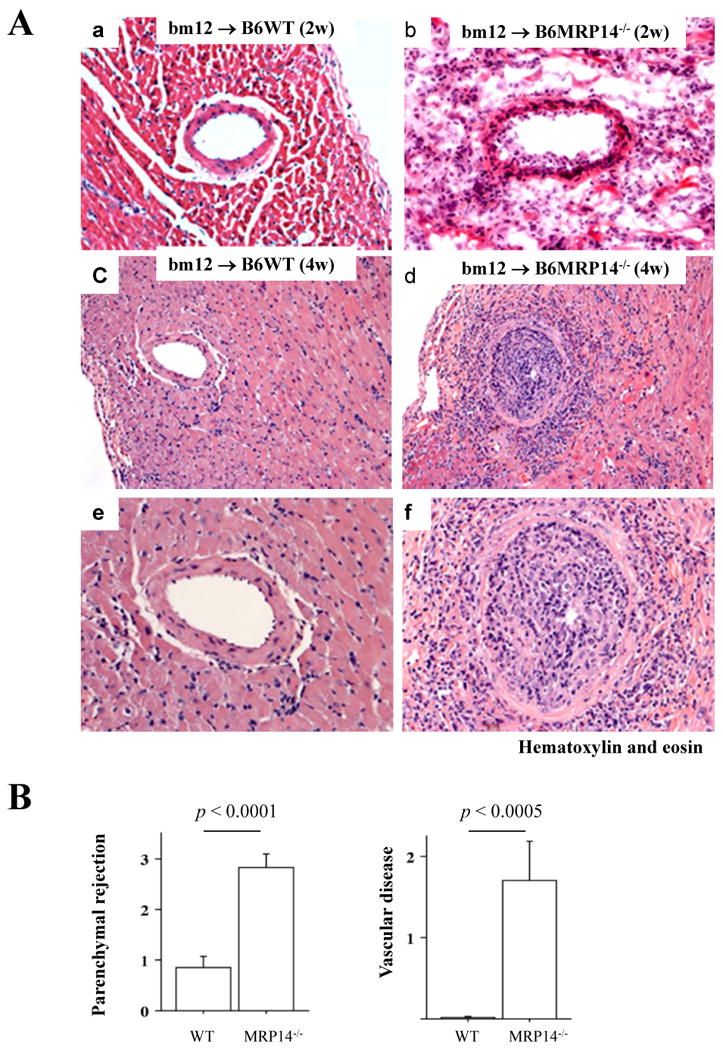
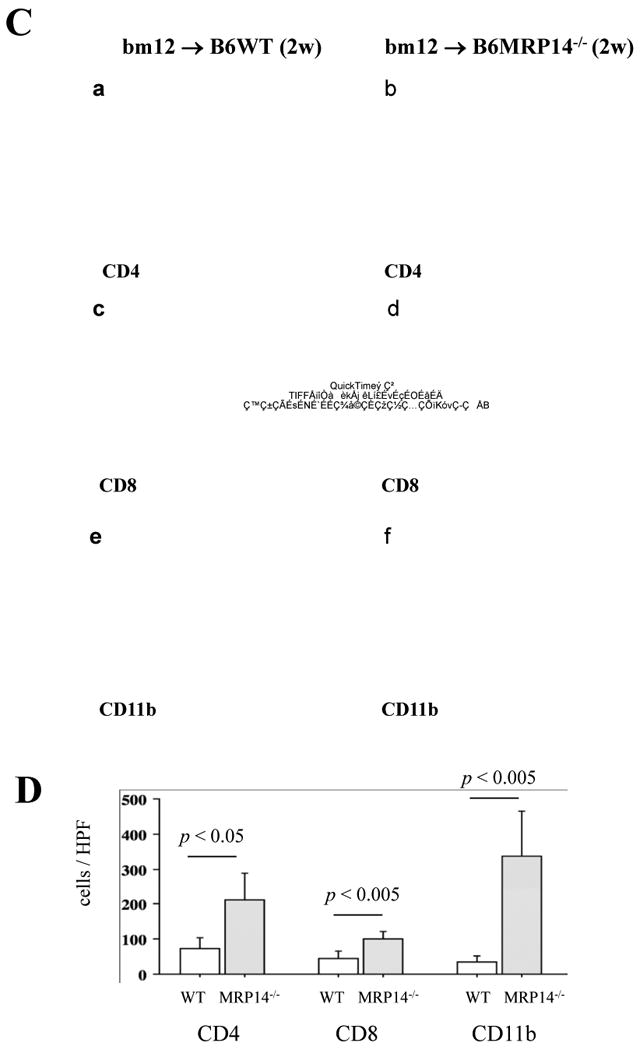
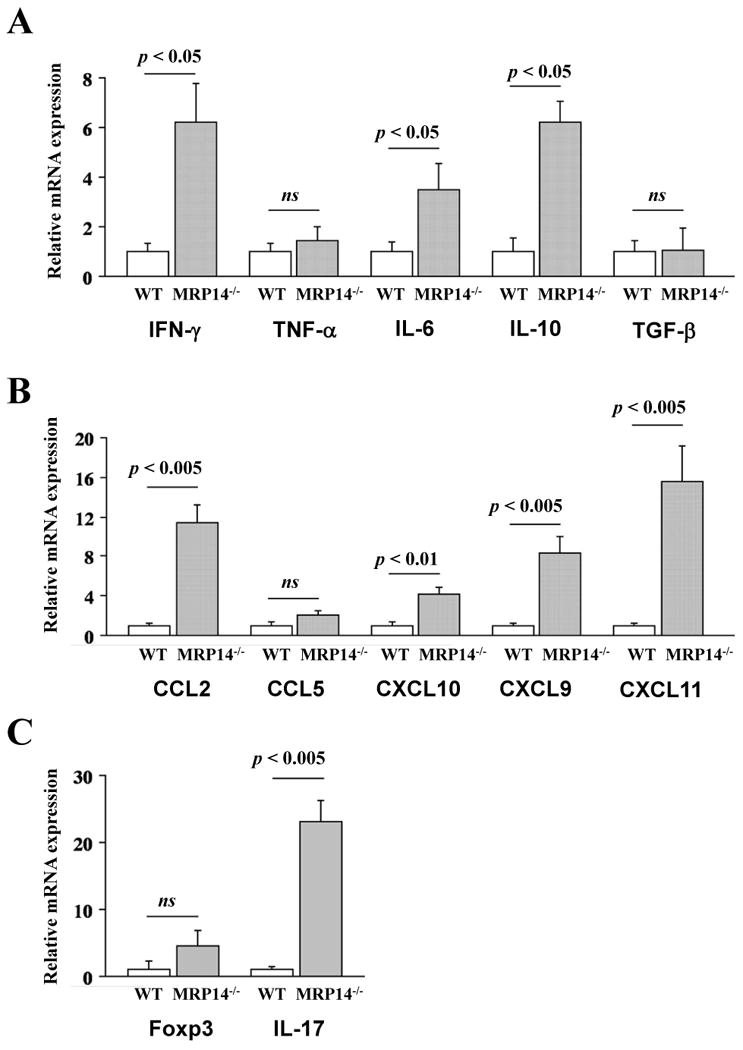
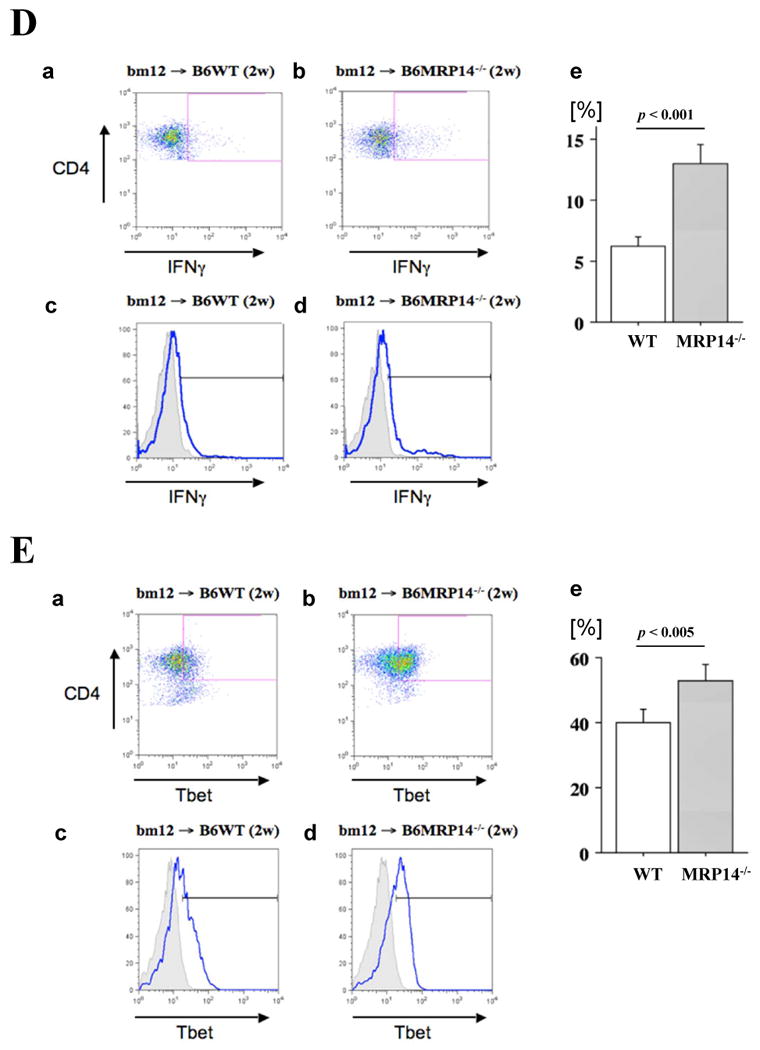
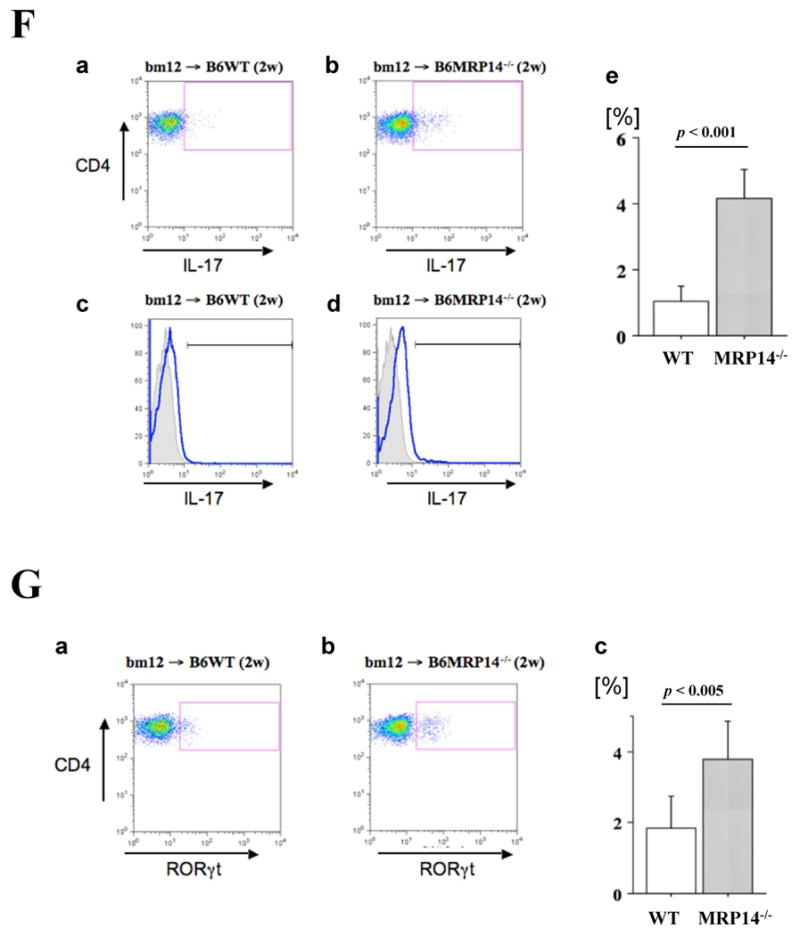
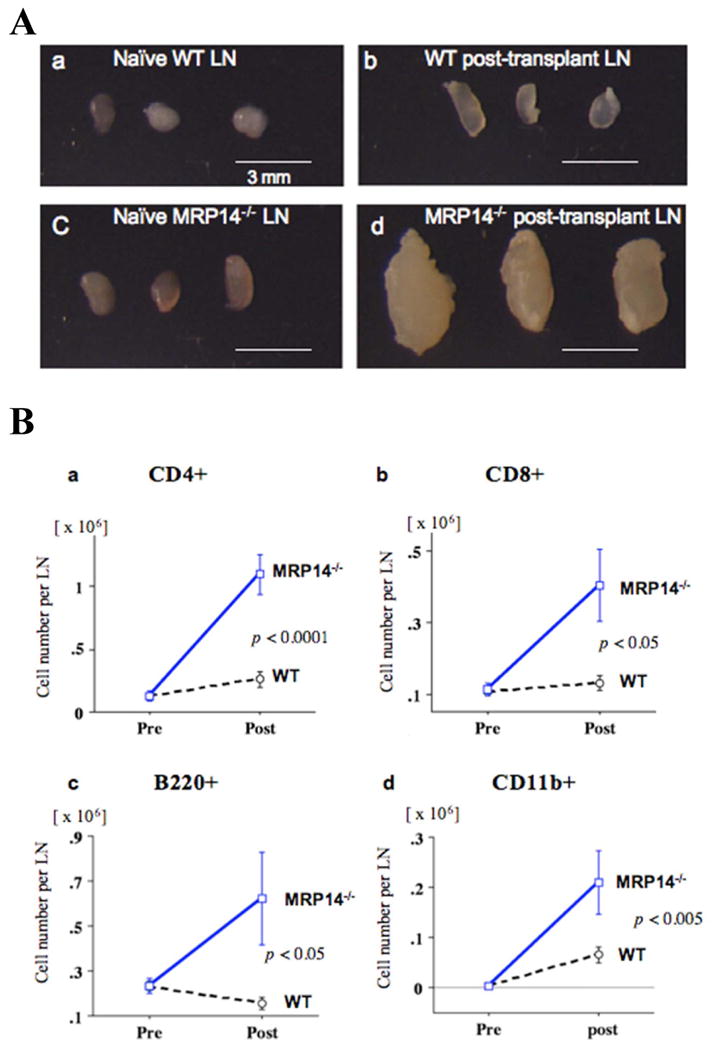
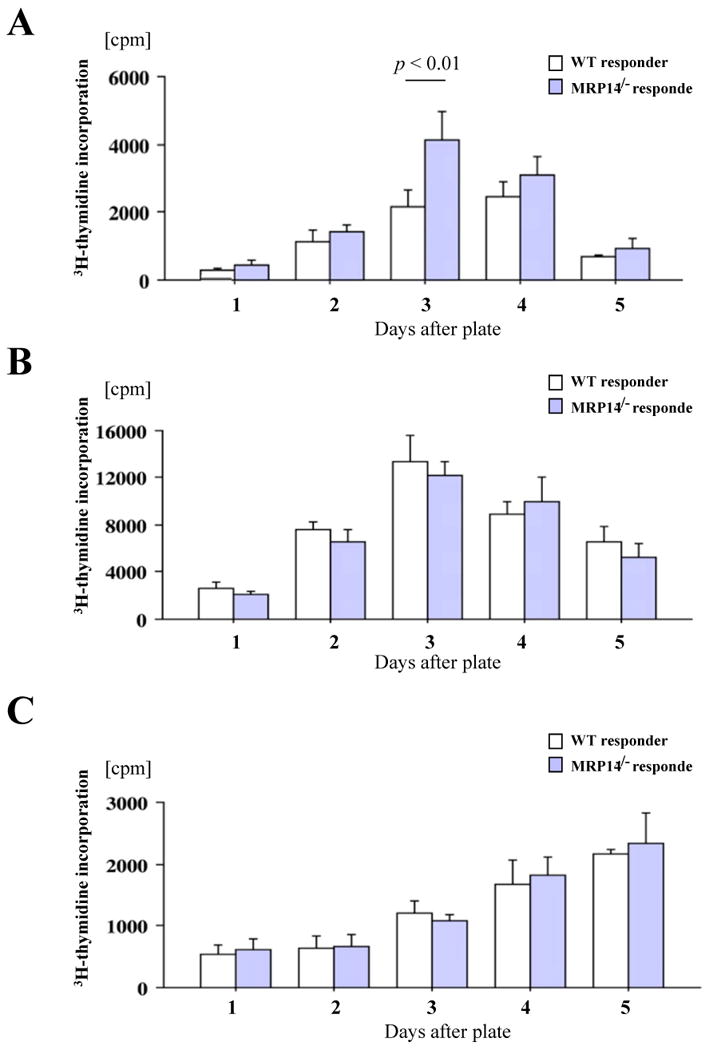
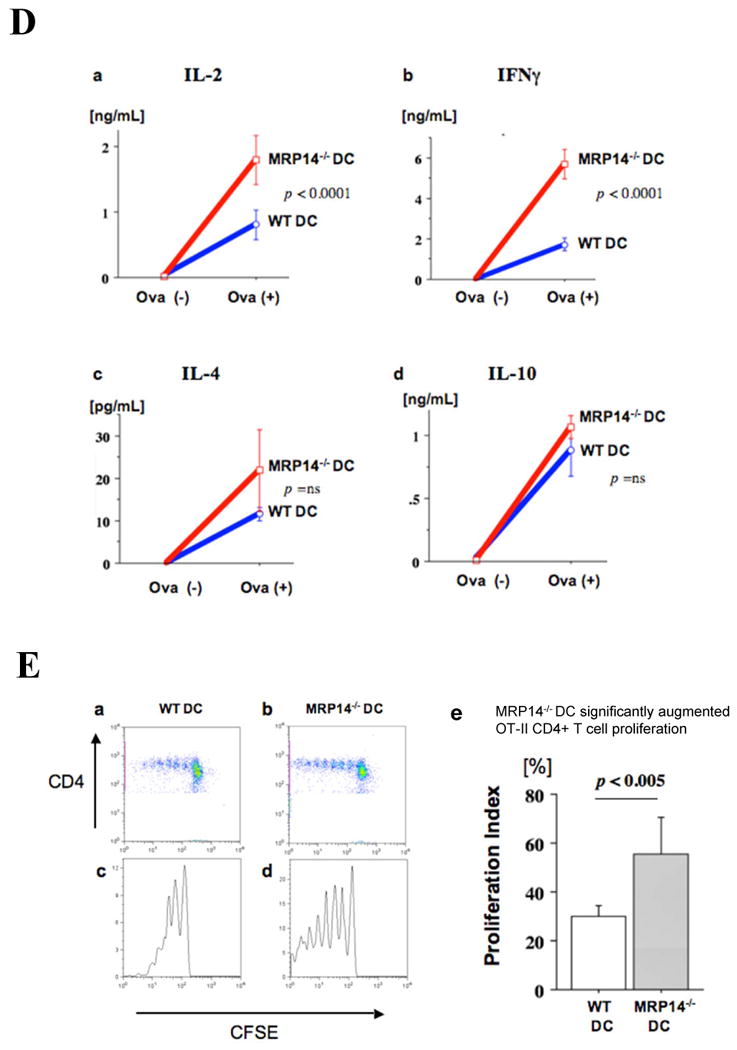
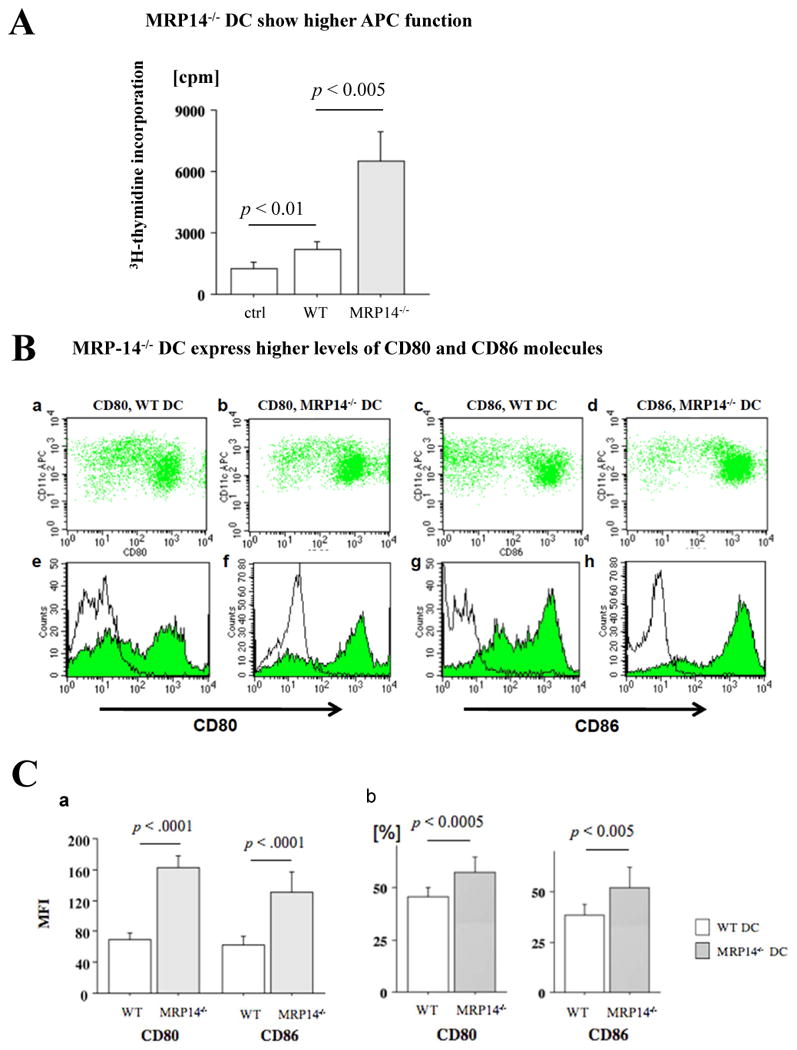
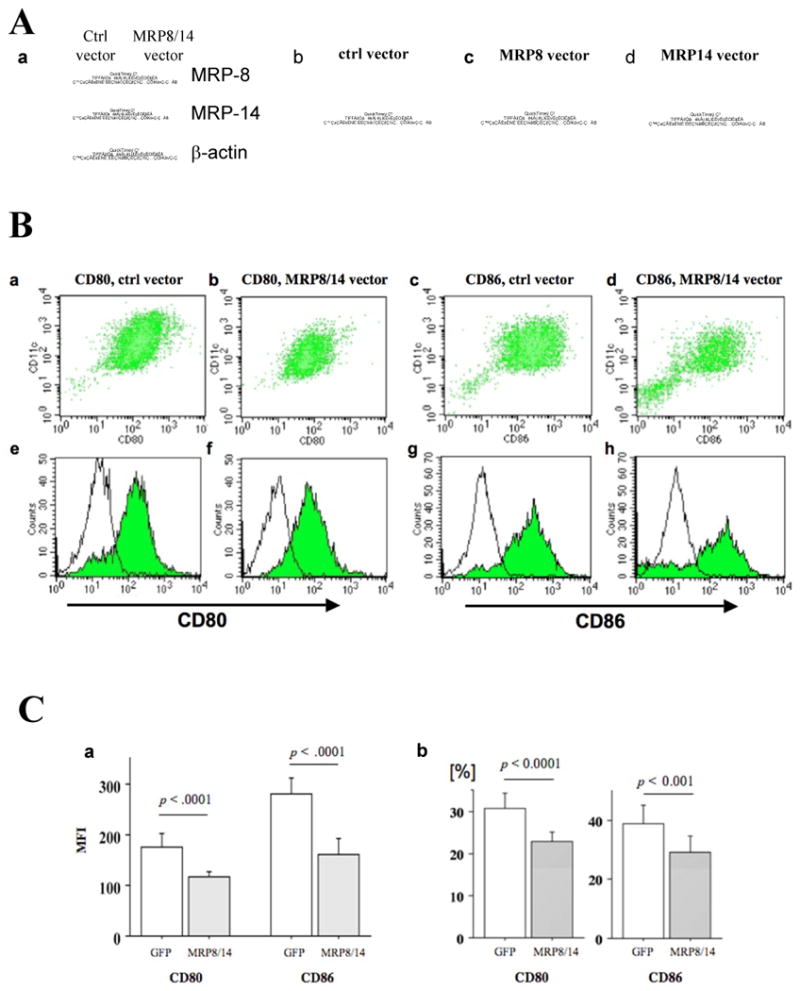
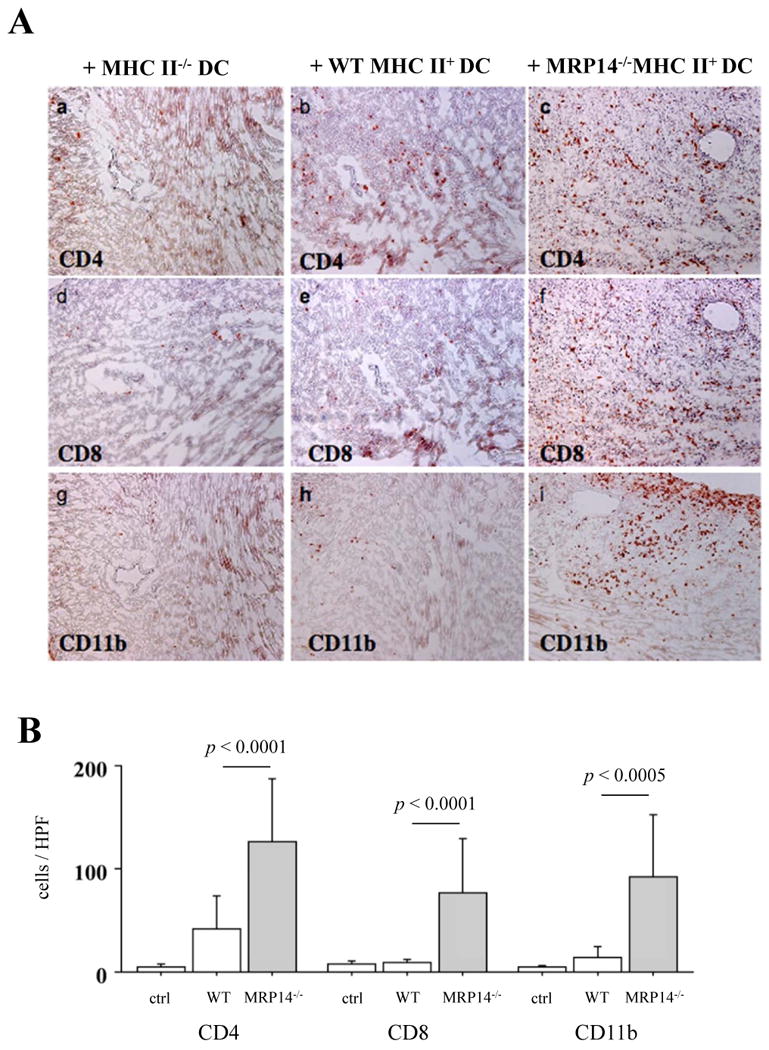
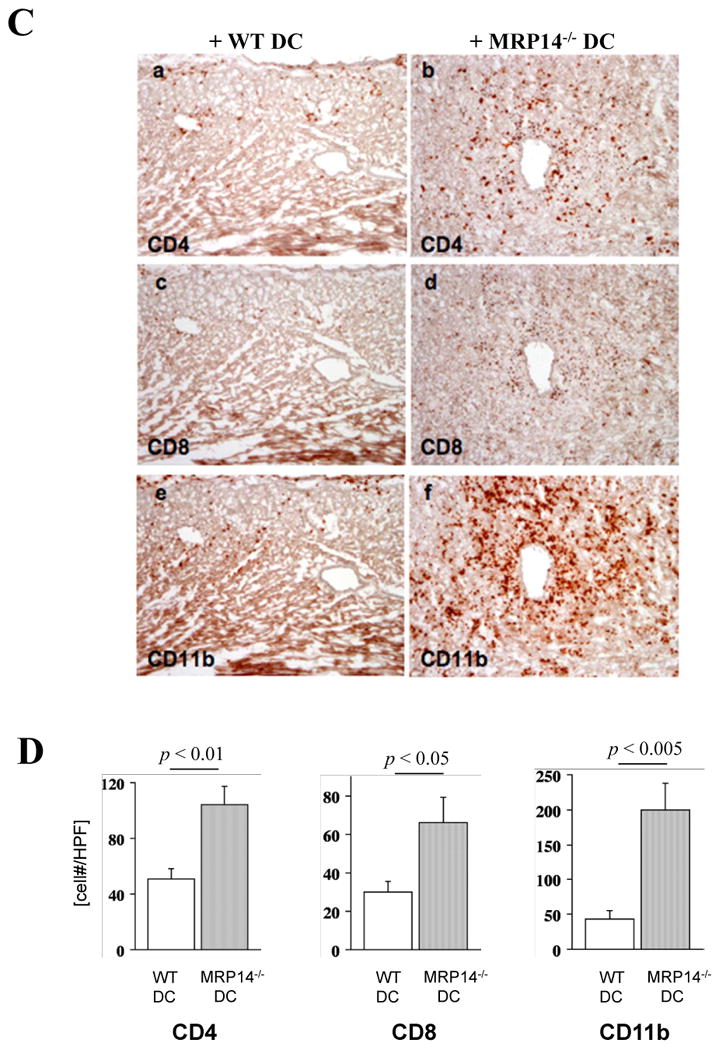
Methods and results: We examined parenchymal rejection after major histocompatibility complex class II allomismatched cardiac transplantation (bm12 donor heart and B6 recipients) in wild-type (WT) and MRP-14(-/-) recipients. Allograft survival averaged 5.9±2.9 weeks (n=10) in MRP-14(-/-) recipients compared with >12 weeks (n=15; P<0.0001) in WT recipients. Two weeks after transplantation, allografts in MRP-14(-/-) recipients had significantly higher parenchymal rejection scores (2.8±0.8; n=8) than did WT recipients (0.8±0.8; n=12; P<0.0001). Compared with WT recipients, allografts in MRP-14(-/-) recipients had significantly increased T-cell and macrophage infiltration and increased mRNA levels of interferon-γ and interferon-γ-associated chemokines (CXCL9, CXCL10, and CXCL11), interleukin-6, and interleukin-17 with significantly higher levels of Th17 cells. MRP-14(-/-) recipients also had significantly more lymphocytes in the adjacent para-aortic lymph nodes than did WT recipients (cells per lymph node: 23.7±0.7×10(5) for MRP-14(-/-) versus 6.0±0.2×10(5) for WT; P<0.0001). The dendritic cells (DCs) of the MRP-14(-/-) recipients of bm12 hearts expressed significantly higher levels of the costimulatory molecules CD80 and CD86 than did those of WT recipients 2 weeks after transplantation. Mixed leukocyte reactions with allo-endothelial cell-primed MRP-14(-/-) DCs resulted in significantly higher antigen-presenting function than reactions using WT DCs. Ovalbumin-primed MRP-14(-/-) DCs augmented proliferation of OT-II (ovalbumin-specific T cell receptor transgenic) CD4(+) T cells with increased interleukin-2 and interferon-γ production. Cardiac allografts of B6 major histocompatibility complex class II(-/-) hosts and of B6 WT hosts receiving MRP-14(-/-) DCs had significantly augmented inflammatory cell infiltration and accelerated allograft rejection compared with WT DCs from transferred recipient allografts. Bone marrow-derived MRP-14(-/-) DCs infected with MRP-8 and MRP-14 retroviral vectors showed significantly decreased CD80 and CD86 expression compared with controls, indicating that MRP-8/14 regulates B7-costimulatory molecule expression.

Conclusions: Our results indicate that MRP-14 regulates B7 molecule expression and reduces antigen presentation by DCs and subsequent T-cell priming. The absence of MRP-14 markedly increased T-cell activation and exacerbated allograft rejection, indicating a previously unrecognized role for MRP-14 in immune cell biology.


Conflict of interest statement

Conflict of Interest Disclosures: None.

Figures

Figure 1
Figure 1. Host MRP-14 deficiency reduces MHC class II-mismatched cardiac allograft survival
Kaplan-Meier analysis of graft survival after (A) total-allomismatched heart transplantation in WT (n=18) and MRP14-/- (n=7) recipients and (B) MHC class II mismatched heart transplantation in WT (n=15) and MRP14-/- (n=10) recipients.
Figure 2
Figure 2. Recipient MRP-14 deficiency accelerates and augments acute parenchymal rejection and vascular infiltration after MHC class II-mismatched transplantation
A. Photomicrographs of H & E staining of bm12 cardiac allografts harvested 2 weeks after transplantation in WT (a) and MRP-14-/- B6 recipients (b), and 4 weeks after transplantation in WT (c, e) and MRP-14-/- B6 recipients (d, f); e and f represent a magnification of the vascular lesions of WT and MRP-14-/- B6 recipient allografts, respectively. B. PR and luminal occlusion scores (mean ± SD) were determined, as described in the Methods section, from hearts harvested from WT (n=12) and MRP-14-/- (n=8) recipients. C. Immunohistochemistry examined immune cell infiltration into transplanted hearts in WT (a, c, e) and MRP-14-/- (b, d, f) recipients 2 weeks after transplantation. Anti-CD4 (a, b), anti-CD8 (c, d), and anti-CD11b (for macrophages; e, f) staining was performed. D. Immune cell accumulation was quantified (mean ± SD) by determining the average number of cells per high-power field (× 100) in WT (n=12, open bars) and MRP-14-/- (n=8, closed bars) recipients.
Figure 3
Figure 3. Cytokine and chemokine mRNA expression and TH17 cells in transplanted hearts
Messenger RNA expression of cytokines (A; IFN-γ, TNF-α, IL-6, IL-10, and TGF-β) and chemokines (B; MCP-1, RANTES, IP-10, Mig, and I-TAC), and Foxp3 and IL-17 (C) in bm12 allografts, was examined by quantitative real-time PCR 2 weeks after transplantation into WT (open bars) or MRP-14-/- (solid bars) recipients. Data represent mean ± SEM, n=6 per group. D–G. Flow cytometric analysis of IFN-γ (D), T-bet (E), IL-17 (F), and RORγt (G) in CD4+ T cells of graft infiltrating cells in WT and MRP-14-/- recipient allografts 2 weeks after transplantation. The shaded gray curve shows negative control using isotype-matched immunoglobulin, and the blue lines show cytokine expression levels in the merged histogram (D, c and d; E, c and d, F, c and d)
Figure 4
Figure 4. Characterization of draining lymph nodes
A. Photomicrographs of naive abdominal para-aortic lymph nodes from WT (a) or MRP-14-/- recipients (c) and abdominal para-aortic lymph nodes adjacent to heterotopic bm12 cardiac allografts of WT (b) or MRP-14-/- recipients (d) 2 weeks after transplantation. B. Cell number per lymph node of naive (Pre, pre-transplant) or 2 weeks after transplantation (Post) WT or MRP-14-/- recipients. a, CD4+ T cells; b, CD8+ T cells; c, B220+ B cells; d, CD11b+ macrophages. Data represent mean ± SEM, n=6 per group.
Figure 5
Figure 5. MRP-14-/- splenocytes have increased proliferation in MLR, but comparable responses to anti-CD3 or anti-CD40 antibodies
A. MLR using WT or MRP-14-/- B6 splenocyte responders and irradiated bm12 splenocyte stimulators. B. T-cell responses of WT and MRP-14-/- B6 splenocytes against immobilized anti-CD3 TCR stimulating antibodies. C. B-cell responses of WT and MRP-14-/- B6 splenocytes against immobilized anti-CD40 stimulating antibodies. Experiments were conducted in quadruplicate wells of a 96-well plate, and were repeated at least three times. D. Cytokine expression levels (a, IL-2; b, IFN-γ; c, IL-4; d, IL-10) of the supernatant of WT or MRP14-/- DCs co-cultured with OT-II CD4+ T cells in the presence (Ova+) or absence (Ova-) of 10 nM ovalbumin. E. Flow cytometry of CFSE-labeled OT-II CD4+ T cells co-cultured with WT (a, c) or MRP14-/- DCs demonstrates cellular proliferation. e, proliferation index; data represent mean ± SEM, n=4 per group.
Figure 6
Figure 6. T-cell proliferation assay shows increased responses to bm12 EC–primed MRP-14-/- DCs
A. MLR to bm12 ECs using non-primed WT DCs (ctrl), bm12 EC–primed MRP-14-/-, or bm12 EC–primed WT, DC stimulators. Data represent peak response 3 days after and average values (mean ± SEM) of three independent experiments. B. MRP-14-/- DCs have augmented APC function. Expression of co-stimulatory molecules on IFN-γ–stimulated DCs from WT (a, c, e, g) and MRP-14-/- (b, d, f, h) mice was assessed by flow cytometry; cells were double-stained with PE-conjugated anti-CD80, anti-CD86, and APC-conjugated anti-CD11c. The shaded gray curve shows negative control using isotype-matched immunoglobulin, and the blue lines show CD80 (e, f) or CD86 (g, h) expression levels in the merged histogram (e-h). C. Values represent mean fluorescence intensity (a) and percentages of CD80-positive or CD86-positive cells (b). Data represent mean ± SEM, n=4 per group; WT (open bars) and MRP-14-/- (solid bars).
Figure 7
Figure 7. MRP-14-/- DCs reconstituted with MRP8/14 retroviral vector showed reduced CD80 and CD86 expression
A. Western blot demonstrates higher expression of MRP-8 and MRP-14 by MRP-14-/- DCs receiving MRP-8/14 retroviral vector infection, compared to control MRP-14-/- DCs receiving empty vector infection (a). MRP-14-/- DCs receiving empty vector (control, b), MRP-8-vector (c), and MRP-14-vector express enhanced GFP, indicating success of infection. B. MRP-14-/- DCs receiving MRP-8/14 retroviral vector infection have reduced APC function. Expression of co-stimulatory molecules on IFN-γ–stimulated DCs of control-vector–treated (a, c, e, g) and MRP-8/14-vector-treated (b, d, f, h) MRP-14-/- DCs was assessed by flow cytometry and double-staining with PE-conjugated anti-CD80, anti-CD86, and APC-conjugated anti-CD11c. The shaded gray curve shows negative control using isotype-matched immunoglobulin, and the blue lines show CD80 (e, f) or CD86 (g, h) expression levels in the merged histogram (e-h). C. Values represent mean fluorescence intensity (a) and percentages of CD80-positive or CD86-positive cells (b). Data represent mean ± SEM, n=4 per group; control-vector-treated (open bars) and MRP-8/14-vector–treated (solid bars).
Figure 8
Figure 8. Cardiac allografts in B6 MHC class II-/- hosts or B6WT receiving MRP-14-/- MHC II+ DCs showed augmented inflammatory cell infiltration
A. Immunohistochemistry examined inflammatory cell infiltration into transplanted hearts in MHC class II-/- hosts receiving MHC class II-/- DCs (a, d, g), B6 WT MHC II+ DCs (b, e, h), and MHC II+ MRP-14-/- DCs (c, f, i) 2 weeks after transplantation. Anti-CD4 (a, b, c), anti-CD8 (d, e, f), and anti-CD11b (g, h, i for macrophages) staining was performed. B. Inflammatory cell accumulation was quantified by determining the average number of cells per high-power field (× 100) in MHC class II-/- hosts receiving MHC class II-/- DCs (open bar), B6 WT MHC II+ DCs (open bar) and MRP-14-/- MHC II+ DCs (solid bar). Data represent mean ± SD, n=6 per group. C. Immunohistochemistry examined inflammatory cell infiltration into transplanted hearts in B6WT hosts receiving B6WT DCs (a, c, e) and MRP-14-/- DCs (b, d, f) 4 weeks after transplantation. Anti-CD4 (a, b), anti-CD8 (c, d), and anti-CD11b (e, f for macrophages) staining was performed. D. Inflammatory cell accumulation was quantified by determining the average number of cells per high-power field (× 100) in B6WT hosts receiving B6WT DCs (open bar) and MRP-14-/- DCs (solid bar). Data represent mean ± SD, n=6 per group.

Similar articles

Cited by

References

    1. Edgeworth J, Gorman M, Bennett R, Freemont P, Hogg N. Identification of p8,14 as a highly abundant heterodimeric calcium binding protein complex of myeloid cells. J Biol Chem. 1991;266:7706–7713. - PubMed
    1. Hunter MJ, Chazin WJ. High level expression and dimer characterization of the S100 EF-hand proteins, migration inhibitory factor-related proteins 8 and 14. J Biol Chem. 1998;273:12427–12435. - PubMed
    1. Lagasse E, Weissman IL. Mouse MRP8 and MRP14, two intracellular calcium-binding proteins associated with the development of the myeloid lineage. Blood. 1992;79:1907–1915. - PubMed
    1. Odink K, Cerletti N, Bruggen J, Clerc RG, Tarcsay L, Zwadlo G, Gerhards G, Schlegel R, Sorg C. Two calcium-binding proteins in infiltrate macrophages of rheumatoid arthritis. Nature. 1987;330:80–82. - PubMed
    1. Nacken W, Sopalla C, Propper C, Sorg C, Kerkhoff C. Biochemical characterization of the murine S100A9 (MRP14) protein suggests that it is functionally equivalent to its human counterpart despite its low degree of sequence homology. Eur J Biochem. 2000;267:560–565. - PubMed

Publication types

MeSH terms