. 2011 Dec 13;20(6):728-40.
doi: 10.1016/j.ccr.2011.11.006. Epub 2011 Dec 1.

Combined genetic inactivation of β2-Microglobulin and CD58 reveals frequent escape from immune recognition in diffuse large B cell lymphoma

Affiliations

Combined genetic inactivation of β2-Microglobulin and CD58 reveals frequent escape from immune recognition in diffuse large B cell lymphoma

Madhavi Challa-Malladi et al. Cancer Cell. .

Abstract

We report that diffuse large B cell lymphoma (DLBCL) commonly fails to express cell-surface molecules necessary for the recognition of tumor cells by immune-effector cells. In 29% of cases, mutations and deletions inactivate the β2-Microglobulin gene, thus preventing the cell-surface expression of the HLA class-I (HLA-I) complex that is necessary for recognition by CD8(+) cytotoxic T cells. In 21% of cases, analogous lesions involve the CD58 gene, which encodes a molecule involved in T and natural killer cell-mediated responses. In addition to gene inactivation, alternative mechanisms lead to aberrant expression of HLA-I and CD58 in >60% of DLBCL. These two events are significantly associated in this disease, suggesting that they are coselected during lymphomagenesis for their combined role in escape from immune-surveillance.


Figures

Figure 1
Figure 1. The B2M gene is targeted by genetic alterations in DLBCL
(A) Schematic representing the distribution of missense, nonsense, and frameshift mutations affecting the B2M genomic region in DLBCL biopsies and cell lines (see also Table S1). (B) Percentage distribution of B2M mutated samples in the major DLBCL subtypes. (C) dChip copy number heat map illustrating focal deletions affecting the B2M locus (arrow) on chromosome 15 in representative DLBCL samples. The first three columns represent normal (diploid) samples (see also Figure S1 and Table S1). (D) Distribution of homozyogous and heterozygous deletions in ABC/NC and GCB DLBCL subtypes (see also Figure S1). (E) Overall frequency and allelic distribution of B2M alterations, including mutations and deletions, in DLBCL (Δ, deletion; M, mutation; WT, wild-type; nd, not determined).
Figure 2
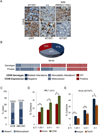
Figure 2. B2M missense mutations affect protein stability
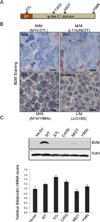
(A) Schematic representation of the B2M protein, with its N-terminal signal peptide (SP) and C-terminal immunoglobulin (Ig)-like C1 domain. Missense mutations are depicted by gray circles. (B) Immunohistochemistry analysis of B2M in DLBCL biopsies (top panel) and cell lines (bottom panel) harboring missense mutant alleles. The exact type of alterations affecting each sample is indicated (Δ, deletion; M, mutation) (Scale = 100 µm). (C) Immunoblot analysis of B2M expression in WSU cells transduced with bicistronic lentiviral vectors expressing WT or missense variants of B2M, and blasticidin downstream of an IRES element (actin, loading control). The bar graph below shows the qRT-PCR quantification of the relative blasticidin mRNA levels (mean +/− SEM), which reflect the abundance of B2M transcripts, in the transduced cells.
Figure 3
Figure 3. Frequent loss of B2M protein expression in DLBCL
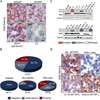
(A) Immunohistochemistry analysis of B2M expression in DLBCL biopsies. Shown are representative examples for the different subcellular localization patterns: membrane (normal), peri-nuclear/Golgi (indicated by arrows), cytosolic, and no detectable staining (see also Table S2 and Figure S2). The genetic configuration of the two B2M alleles is indicated for each case (Scale = 100 µm). (B) Top panel: overall percentage of DLBCL primary biopsies showing absent (negative), mislocalized, or normal (membrane positive) B2M expression. Bottom panel: pie charts representing percent distribution of B2M expression, according to genotype. Note that the “monoallelic” cases also include 3 samples where the status of the second allele could not be determined. The total number of cases analyzed in each group is specified at the bottom. (C) Immunoblot analysis for B2M and tubulin (loading control) in DLBCL cell lines carrying WT or genetically altered B2M alleles, as indicated. (D) Immunohistochemistry analysis of B2M expression in representative DLBCL cell lines showing various subcellular distribution patterns. The status of the B2M locus is indicated (Scale = 100 µm).
Figure 4
Figure 4. Defects in B2M expression associate with the lack of cell surface HLA-I
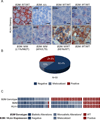
(A) Immunohistochemistry analysis of HLA-I in DLBCL samples using the HC-10 antibody, which recognizes HLA-B and C. The genetic status of B2M is indicated for each sample (Scale = 100 µm). (B) Percentage distribution of DLBCL samples with negative, mislocalized, and positive cell surface expression of HLA-I. (C) Relationship between B2M genetic status and expression of the B2M and HLA-I proteins in DLBCL biopsies. In the heatmap, each column represents one DLBCL sample; the genotype and staining patterns are color-coded as indicated (* this category includes 3 mutated samples where the status of the second allele could not be determined).
Figure 5
Figure 5. Reintroduction of B2M WT, but not mutant alleles result in restoration of cell surface HLA-I
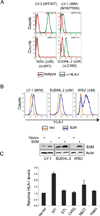
(A) Flow cytometric analysis of cell surface HLA-I expression in three DLBCL cell lines harboring biallelic B2M lesions, and a B2M wild-type cell line. The corrected mean fluorescence intensities (cMFI = HLA-I antibody MFI minus Isotype control MFI) are indicated. Note the complete lack of expression in WSU, and the significantly reduced levels in two additional cell lines carrying a B2M missense mutation with genetic loss of the second allele. (B) HLA-I expression in the three DLBCL cell lines upon reintroduction of WT B2M (blue), as compared to empty vector control (yellow). Western blot analysis of B2M expression in the same cells confirms the presence of exogenous B2M protein. Actin, loading control. (C) Relative cell surface HLA-I levels (mean +/− SEM), assessed by flow cytometry, in the WSU cell line reconstituted with vectors expressing WT or missense mutants of B2M, as compared to empty vector (arbitrarily set as 1).
Figure 6
Figure 6. The CD58 gene is a target of genetic alterations in DLBCL
(A) Schematic diagram of the CD58 gene (top) and protein (bottom), with its known functional domains (SP, signal peptide; Ig, Immunoglobulin single-pass type I membrane; TM, transmembrane; C, cytoplasmic). Color-coded symbols depict distinct types of mutations (see also Table S3). (B) Percentage of mutated biopsies and cell lines in the GCB and ABC/NC DLBCL subtypes. (C) dChip SNP inferred copy number heatmap of the 1p13.1 region encompassing CD58 in representative DLBCL cases and three normal (diploid) DNAs (see also Figure S3 and Table S3). (D) Percentage of samples harboring CD58 deletions in GCB and ABC/NC DLBCL subtypes. The actual number of samples over total analyzed is shown on top. (E) Overall frequency of CD58 structural alterations in DLBCL (Δ, deletion; M, mutation; nd, not determined).
Figure 7
Figure 7. Aberrant expression of the CD58 protein in DLBCL affects NK cell-mediated cytolysis
(A) CD58 protein expression in representative DLBCL biopsies (genomic status as indicated: Δ, deletion; M, mutated; WT, wild type) (see also Table S4) (Scale = 100 µm). (B) Overall proportion of DLBCL biopsies showing defective CD58 surface expression (top). The relationship between CD58 genetic lesions and protein expression pattern in individual cases is presented below (* this category includes 5 mutated samples where the status of the second allele could not be determined). (C) Frequency of cases showing aberrant CD58 surface expression in DLBCL subtypes. (D) Percent NK cell-mediated cytolysis of HBL1 cells transduced with lentiviral vectors expressing CD58 (or empty vectors) at various effector to target (E:T) ratios (mean +/− SD; *, p < 0.001). Data shown represents one of three independent experiments performed in triplicate (see also Figure S4). (E) NK cell mediated cytolysis in the DLBCL cell line RIVA (WT for CD58) after blocking cell surface CD58 by anti-CD58 TS2/9 antibodies (mean +/− SD; *, p < 0.001; **, p < 0.01). Data shown represents one of two experiments performed in triplicate (see also Figure S4).
Figure 8
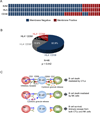
Figure 8. Concurrent loss of cell surface HLA-I and CD58 is a common feature in DLBCL
(A) Distribution of B2M, HLA-I and CD58 membrane protein expression in DLBCL. Columns represent individual DLBCL patients, with color codes indicating the presence or absence of surface B2M, HLA-I, and CD58 protein. (B) Overall proportion of DLBCL biopsies showing lack of HLA-I and CD58 surface protein expression. A two-tailed Fisher’s exact test was used to determine whether the correlation in the expression patterns of HLA-I and CD58 was statistically significant across individual DLBCL patients. C) Model for the mechanism of immune escape in DLBCL. Lymphoma cells displaying tumor-associated antigens through HLA-I are recognized and subsequently lysed by CTLs. To evade CTL recognition, tumors often downregulate HLA-I expression (top). However, HLA-I also acts as a ligand for the NK cell inhibitory receptors that transduce signals to counterbalance the activating cues from receptors such as CD2. Thus, tumor cells devoid of HLA-I are vulnerable to NK cell attack due to activation of NK cell CD2 by tumor cell CD58 (middle). In DLBCL, concurrent loss of HLA-I and CD58 confers protection from both T and NK cell mediated lysis (bottom).

Similar articles

Cited by

References

    1. Abramson JS, Shipp MA. Advances in the biology and therapy of diffuse large B-cell lymphoma: moving toward a molecularly targeted approach. Blood. 2005;106:1164–1174. - PubMed
    1. Altomonte M, Gloghini A, Bertola G, Gasparollo A, Carbone A, Ferrone S, Maio M. Differential expression of cell adhesion molecules CD54/CD11a and CD58/CD2 by human melanoma cells and functional role in their interaction with cytotoxic cells. Cancer Res. 1993;53:3343–3348. - PubMed
    1. Billaud M, Rousset F, Calender A, Cordier M, Aubry JP, Laisse V, Lenoir GM. Low expression of lymphocyte function-associated antigen (LFA)-1 and LFA-3 adhesion molecules is a common trait in Burkitt's lymphoma associated with and not associated with Epstein-Barr virus. Blood. 1990;75:1827–1833. - PubMed
    1. Bjorkman PJ, Saper MA, Samraoui B, Bennett WS, Strominger JL, Wiley DC. Structure of the human class I histocompatibility antigen, HLA-A2. Nature. 1987;329:506–512. - PubMed
    1. Bolhuis RL, Roozemond RC, van de Griend RJ. Induction and blocking of cytolysis in CD2+, CD3− NK and CD2+, CD3+ cytotoxic T lymphocytes via CD2 50 KD sheep erythrocyte receptor. J Immunol. 1986;136:3939–3944. - PubMed

Publication types

MeSH terms

Substances

Associated data